About the Project
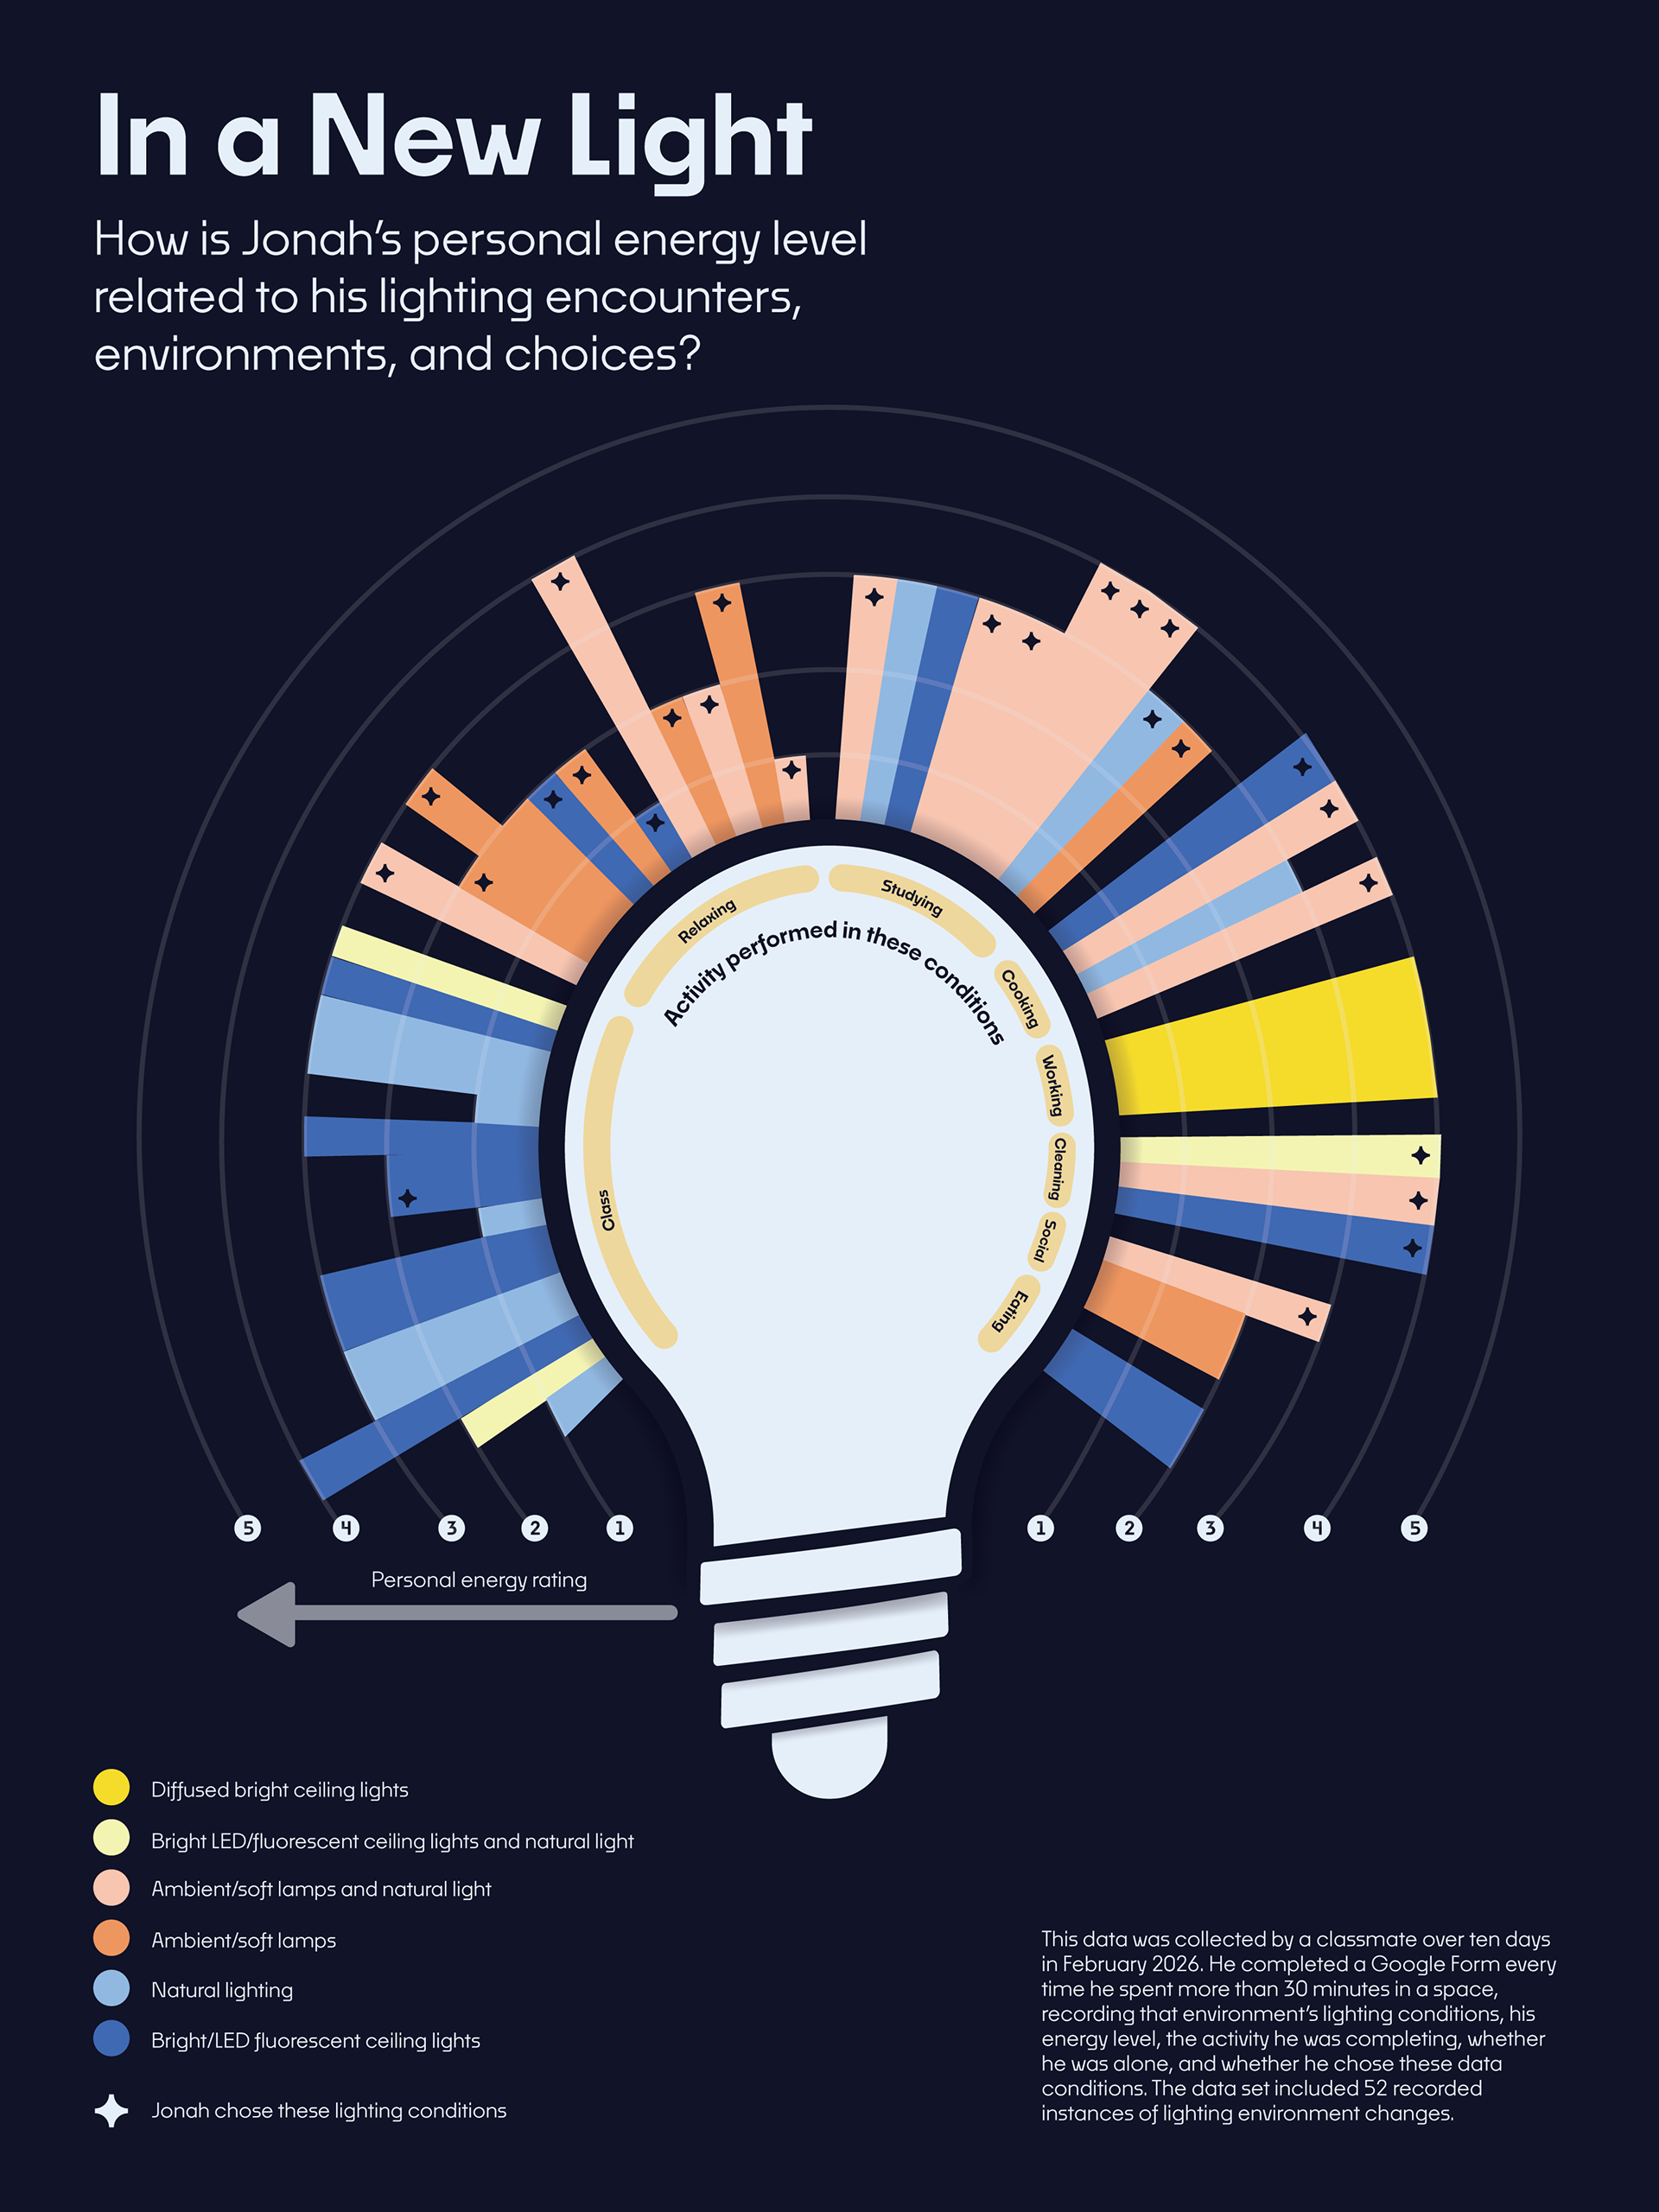
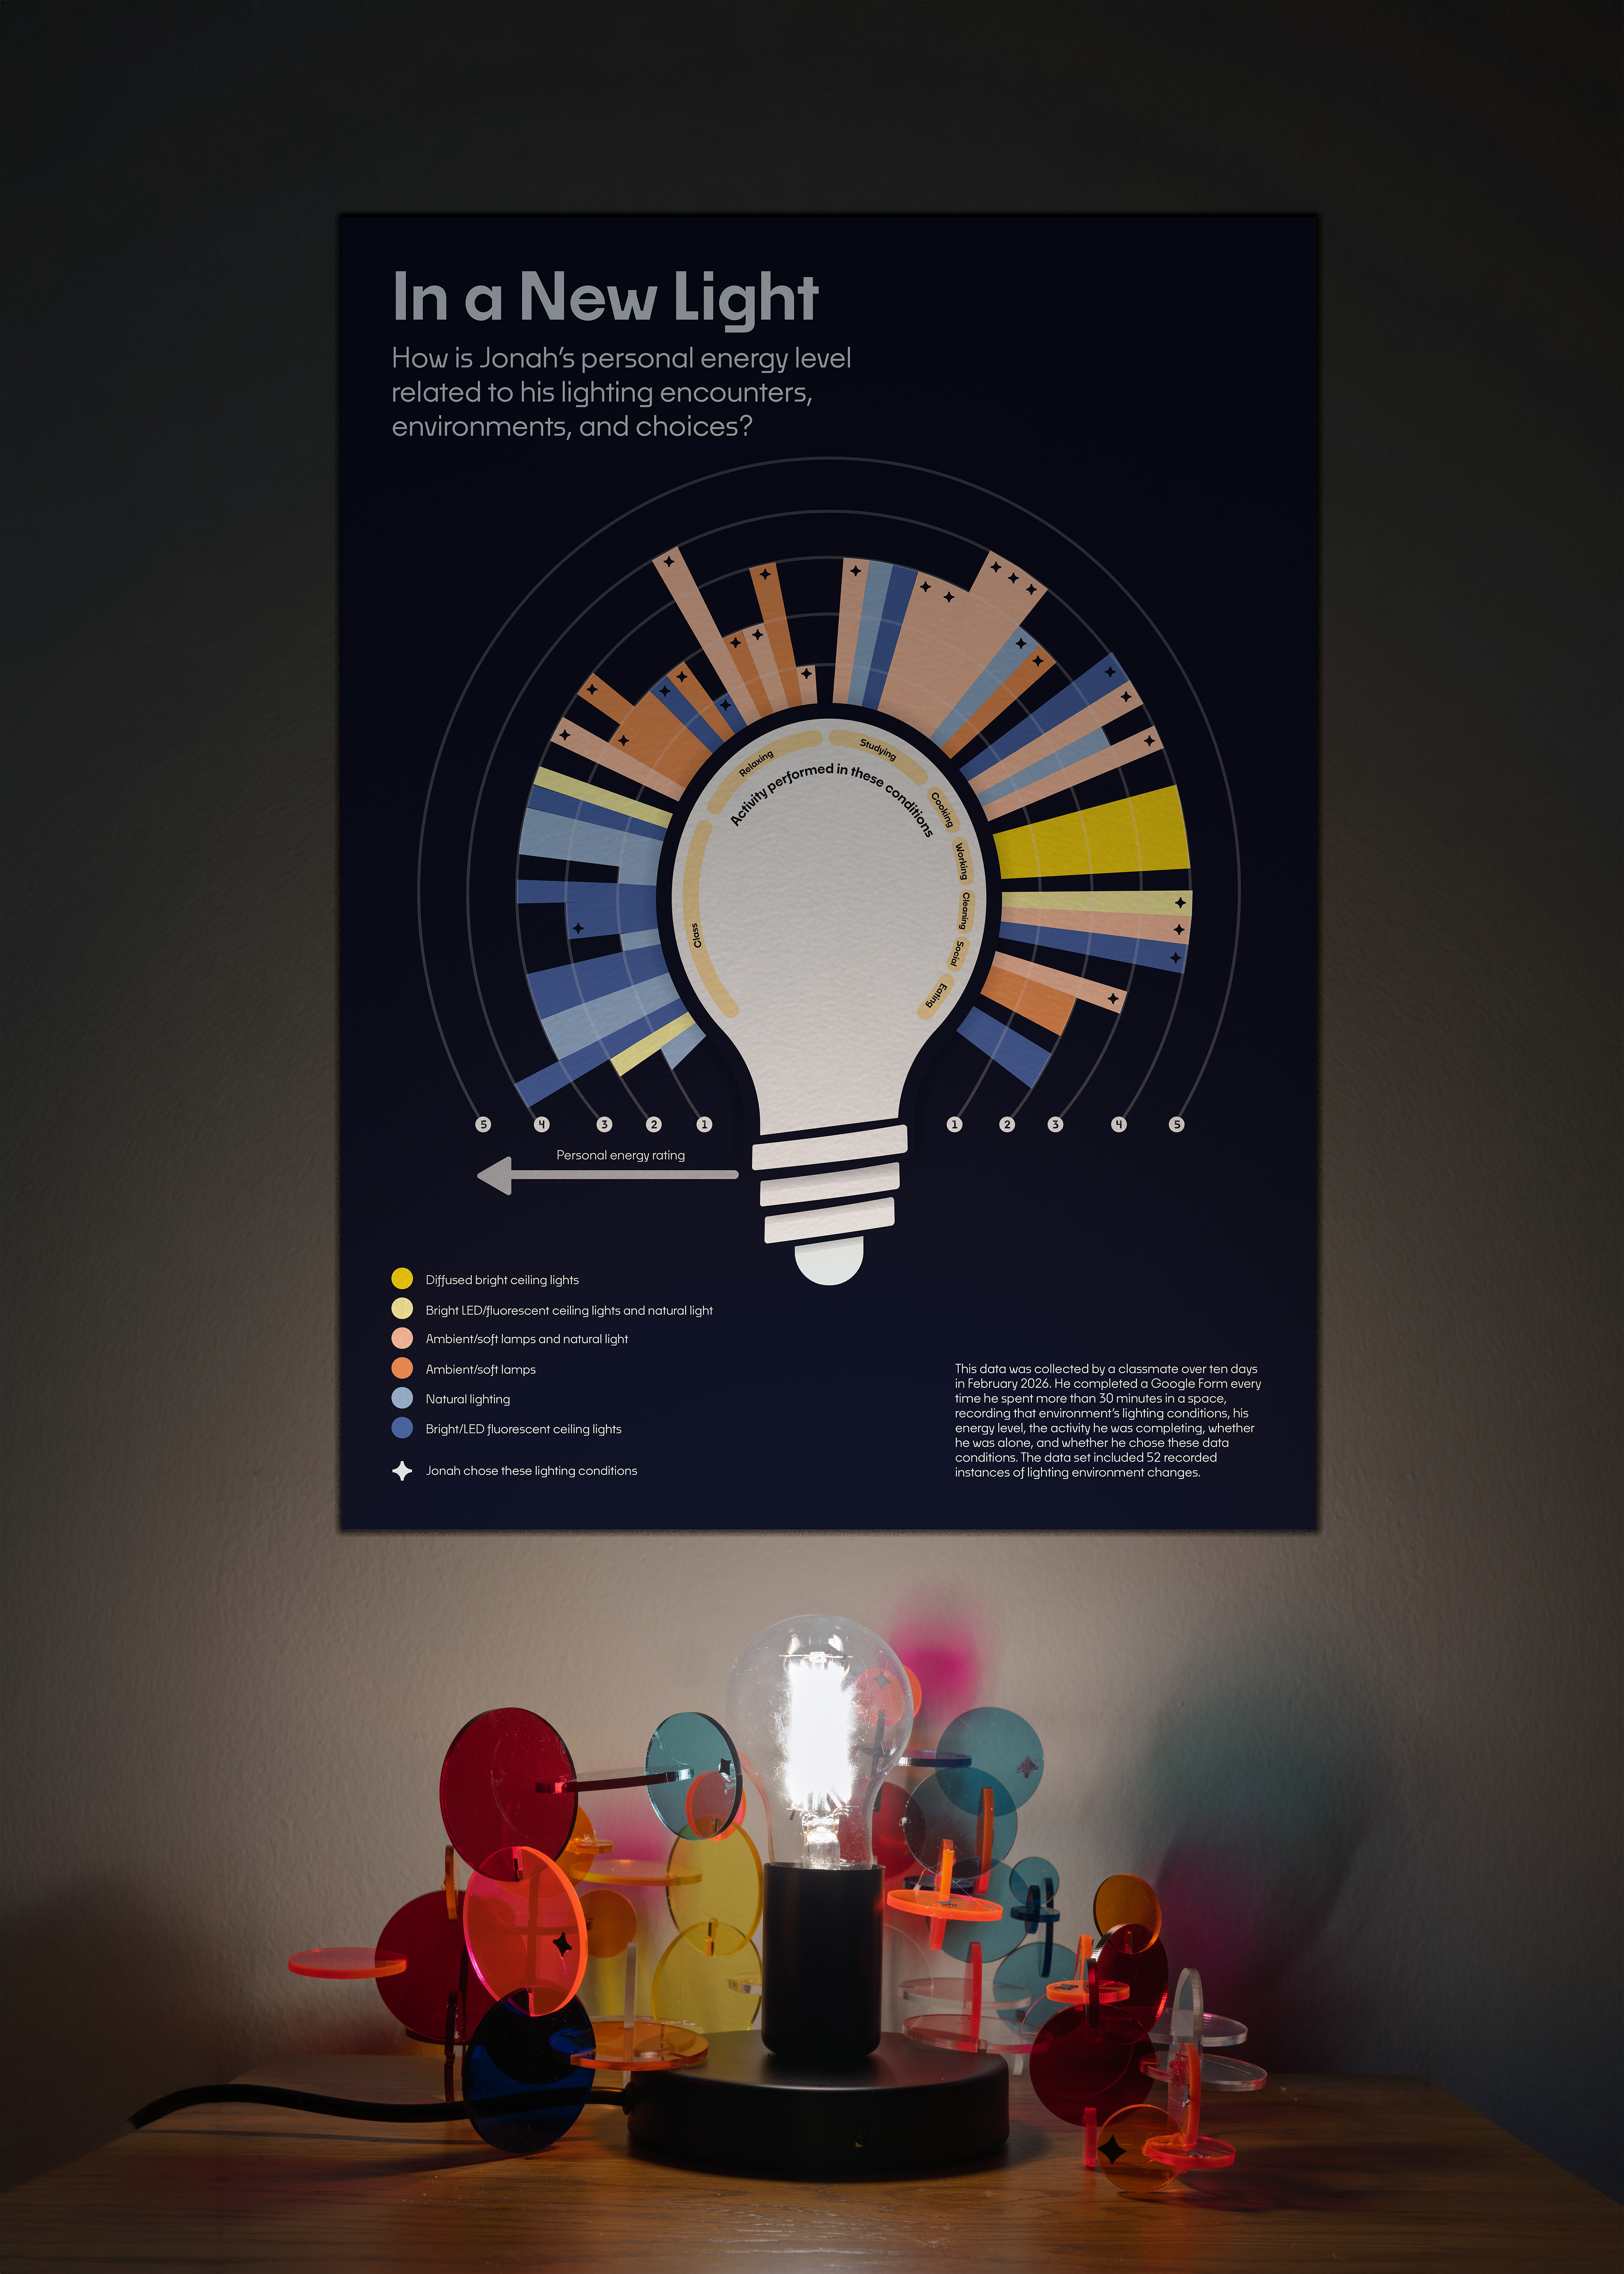
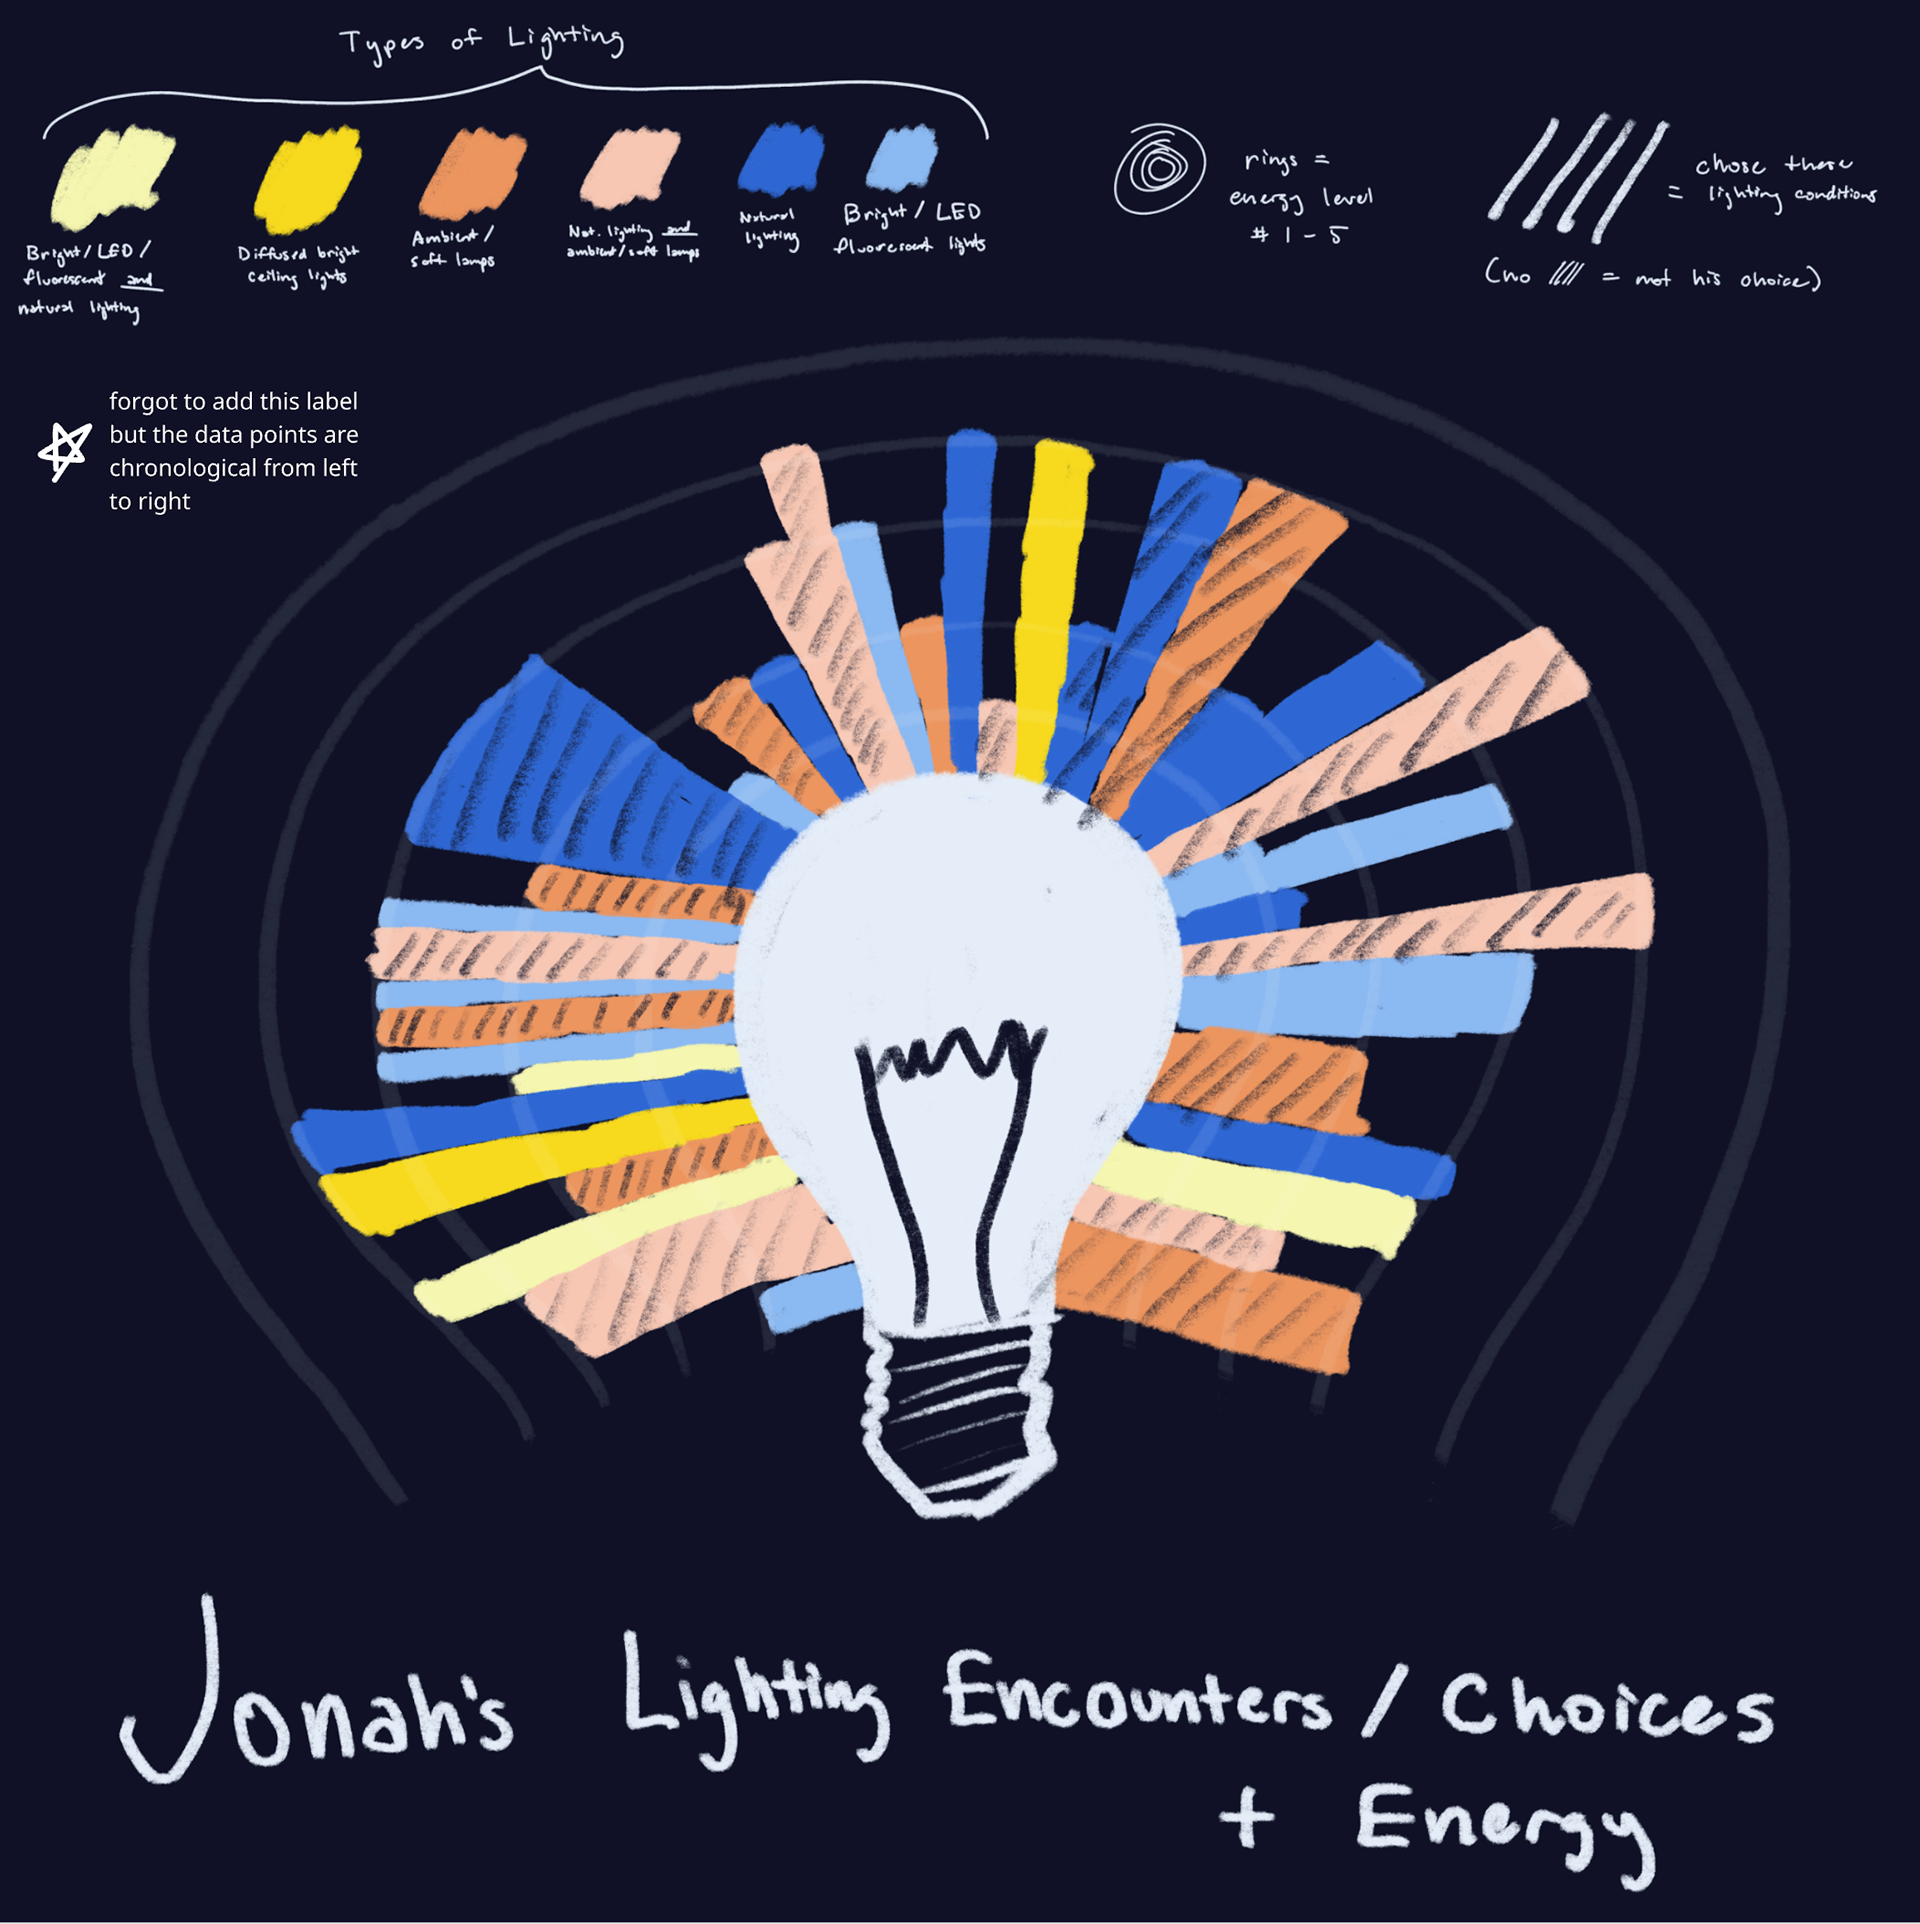
For this assignment, I was tasked with collecting data from a classmate on a specific topic, then turning this data into a visual poster and physical representation. I asked my partner, Jonah, to track the lighting environments he encountered over ten days, including data points like type of lighting, type of activity, his personal energy level ranked 1-5, and whether he chose those lighting conditions. Below are the final poster, an abstract representation of the data in a colorful lamp projection, and photo of the two pieces together.
The poster is a clear, visually relevant representation of Jonah's energy levels as he performs various activities and makes lighting decisions throughout his everyday life. The lightbulb form makes the poster's topic immediately clear to viewers, and the varied length of the radial bars acts as light radiating from the center form. Additionally, small sparkle icons on certain bars indicate that these lighting conditions were chosen by Jonah, while those without the icon were out of his control.
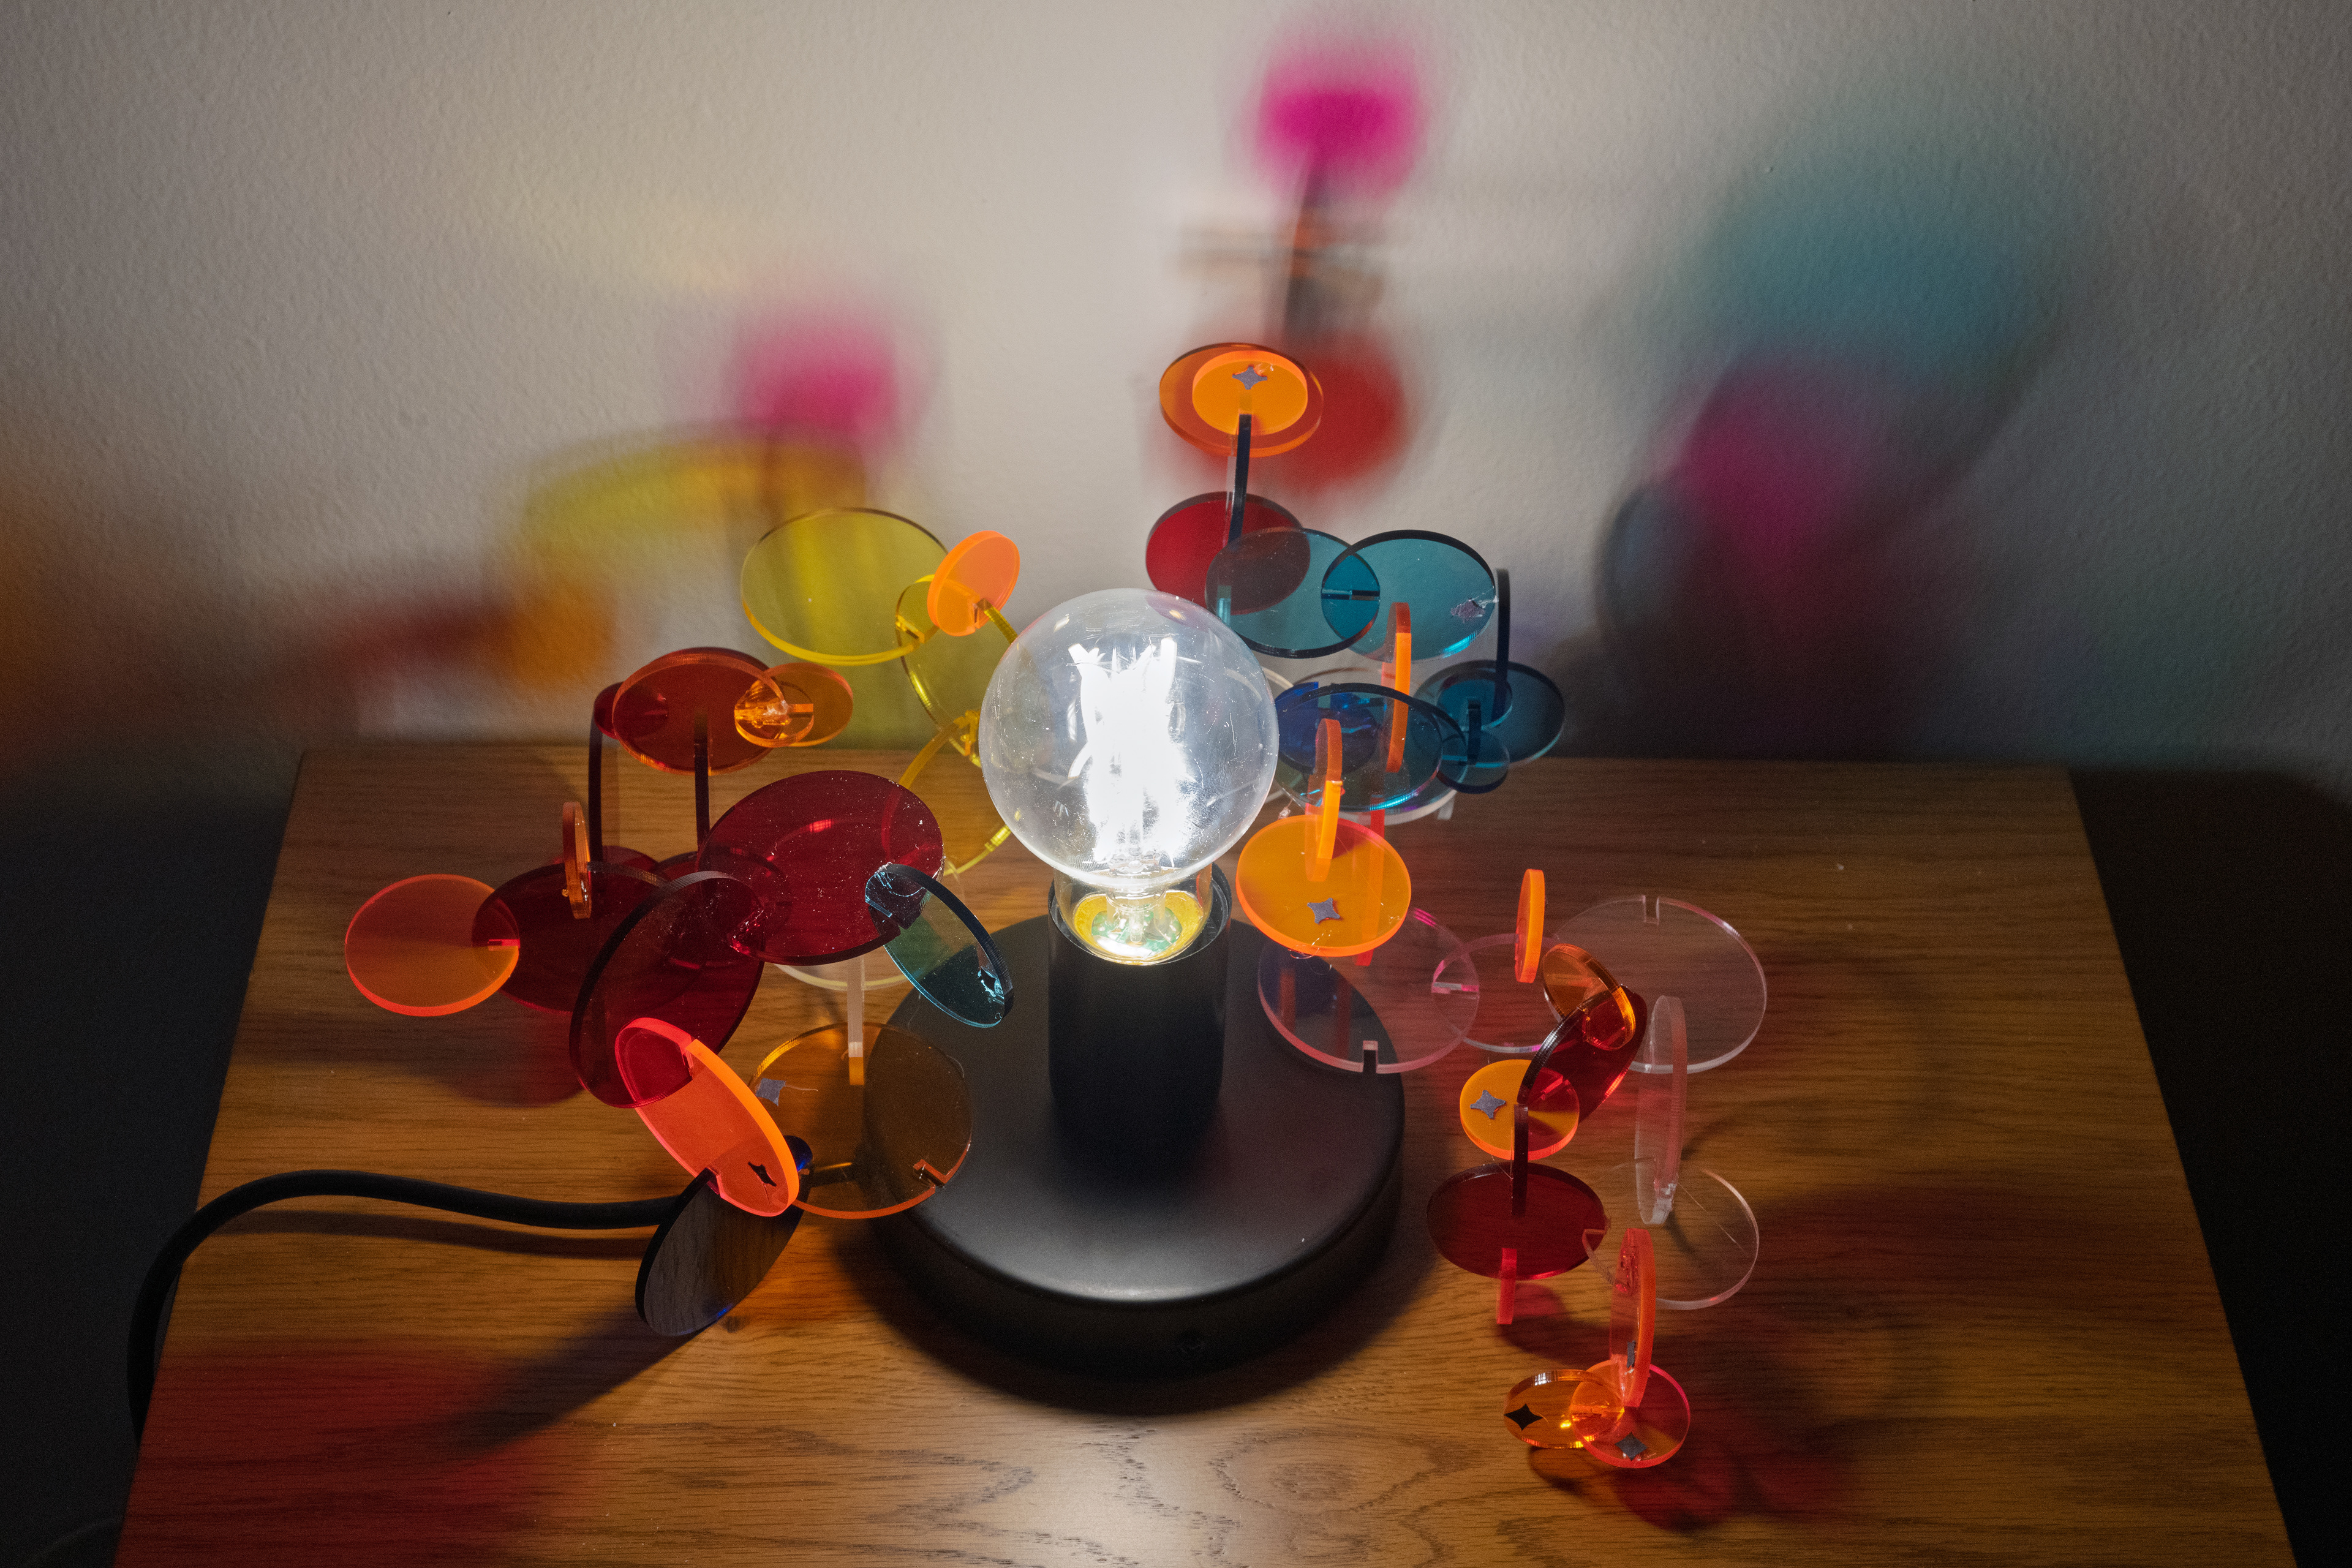
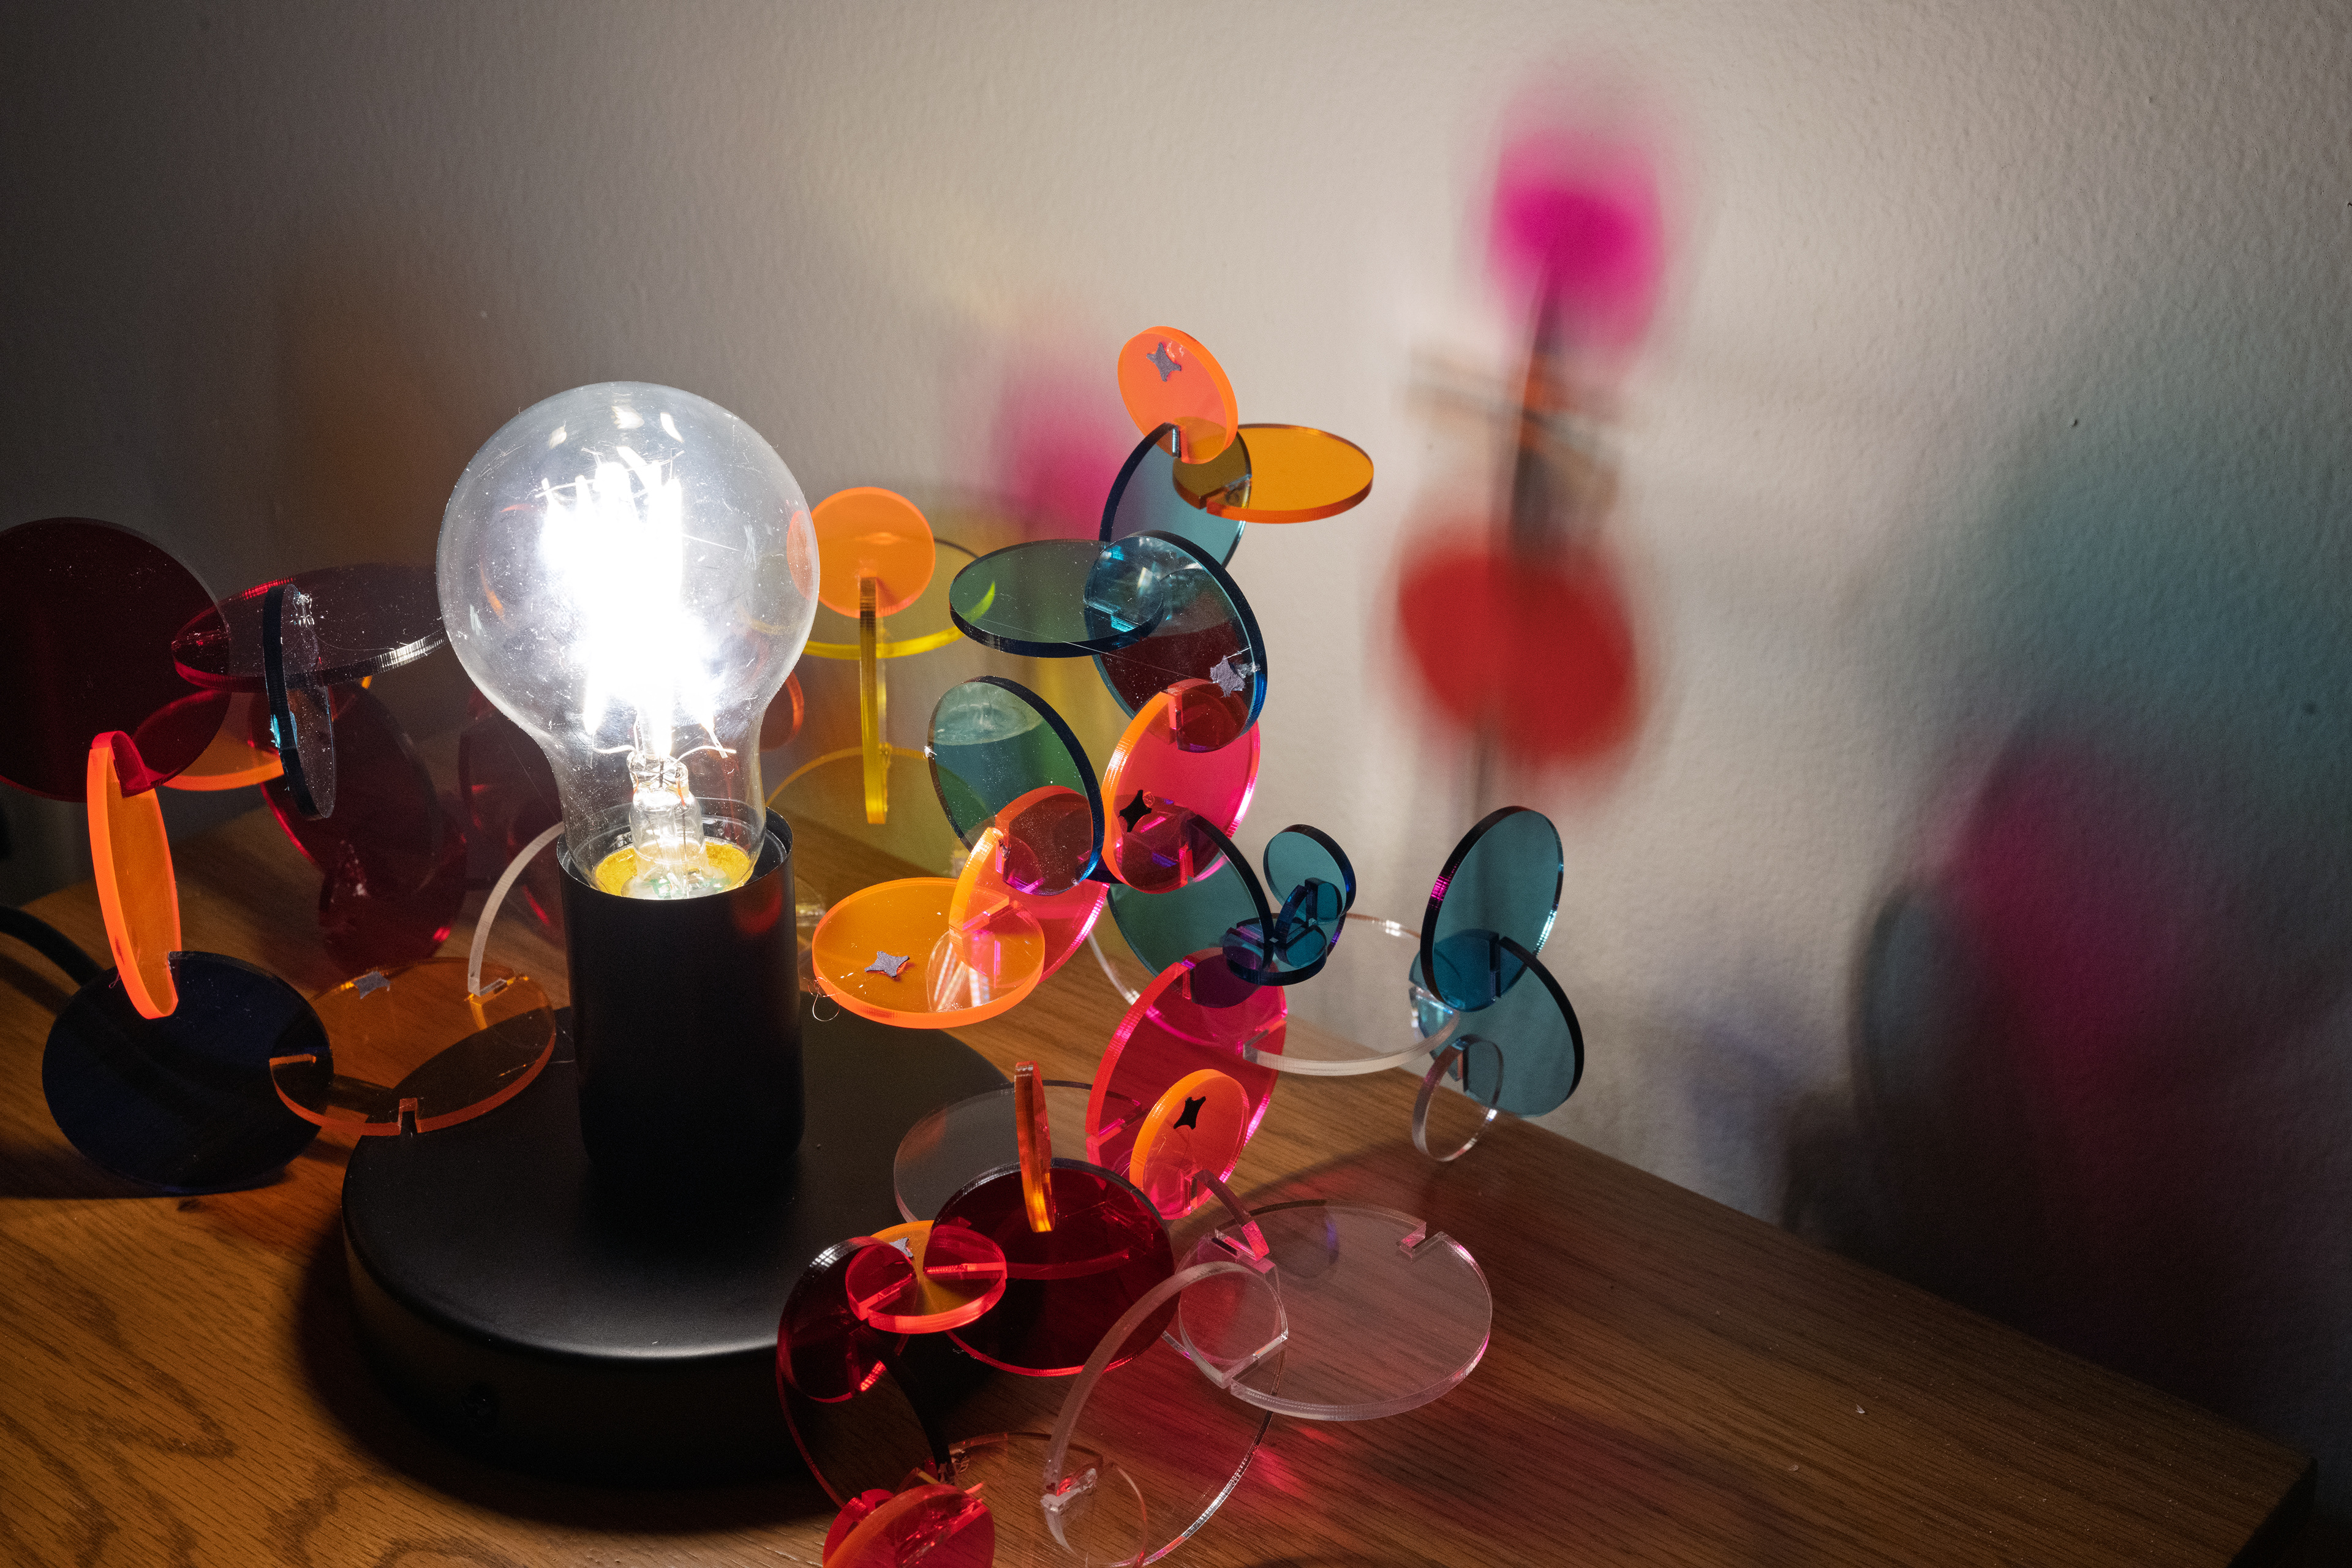
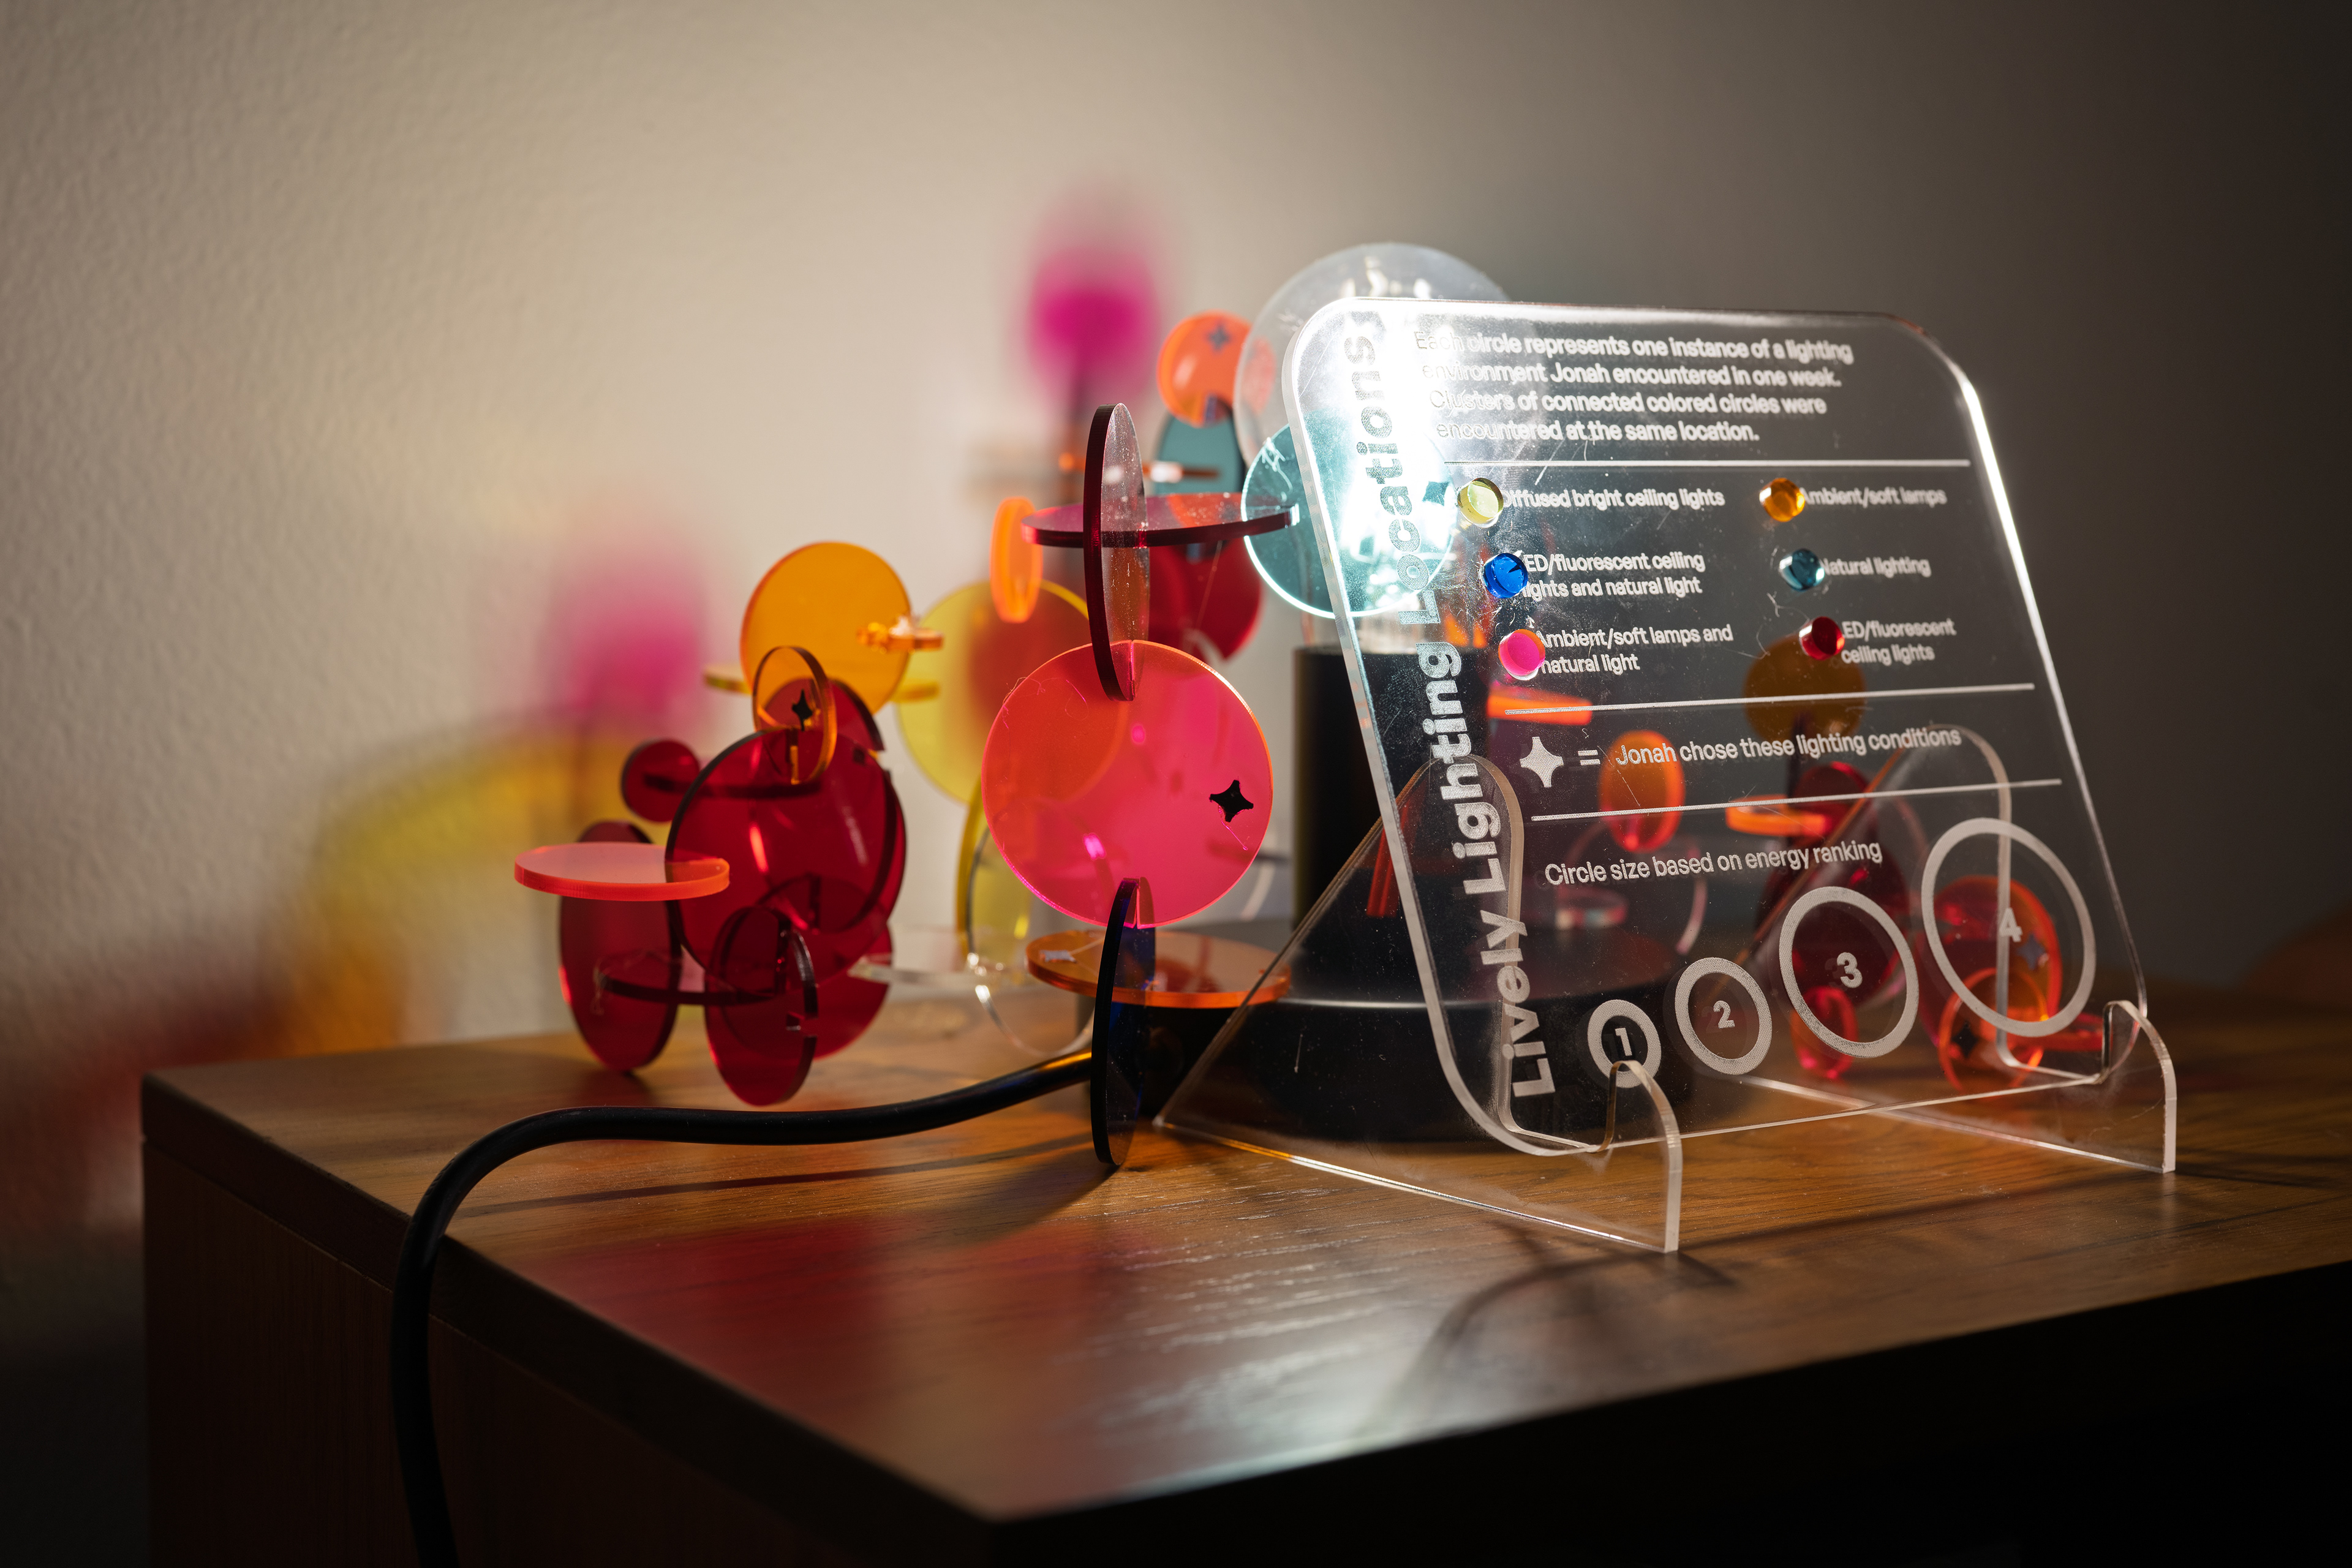
The lamp acts as an abstract representation of Jonah's data in a form that is not only relevant to the data set, but also useful and inspirational for Jonah. His data helped me to discover that he thrives in environments where he chooses ambient, soft lighting like warm desk lamps, so in addition to its concrete representation of the data set, it can also function as an inspirational home decor item. Since it is made of acrylic disks with small interlocking slots, it can also act as a modular lamp with the circles rearranged to cluster around new variables. Over time, Jonah could also continue adding additional circles to build out the lamp shade with new data; the base form only focuses on one week of data, but it could easily be expanded with more data by building upon the existing structure.
Part One: Analysis and Poster
I began by choosing a research question based on what I knew about my partner, Jonah. After noticing the soft ambient lighting behind him during class Zoom meetings, I decided to give him prompts to track the lighting environments he encountered in his day-to-day activities.
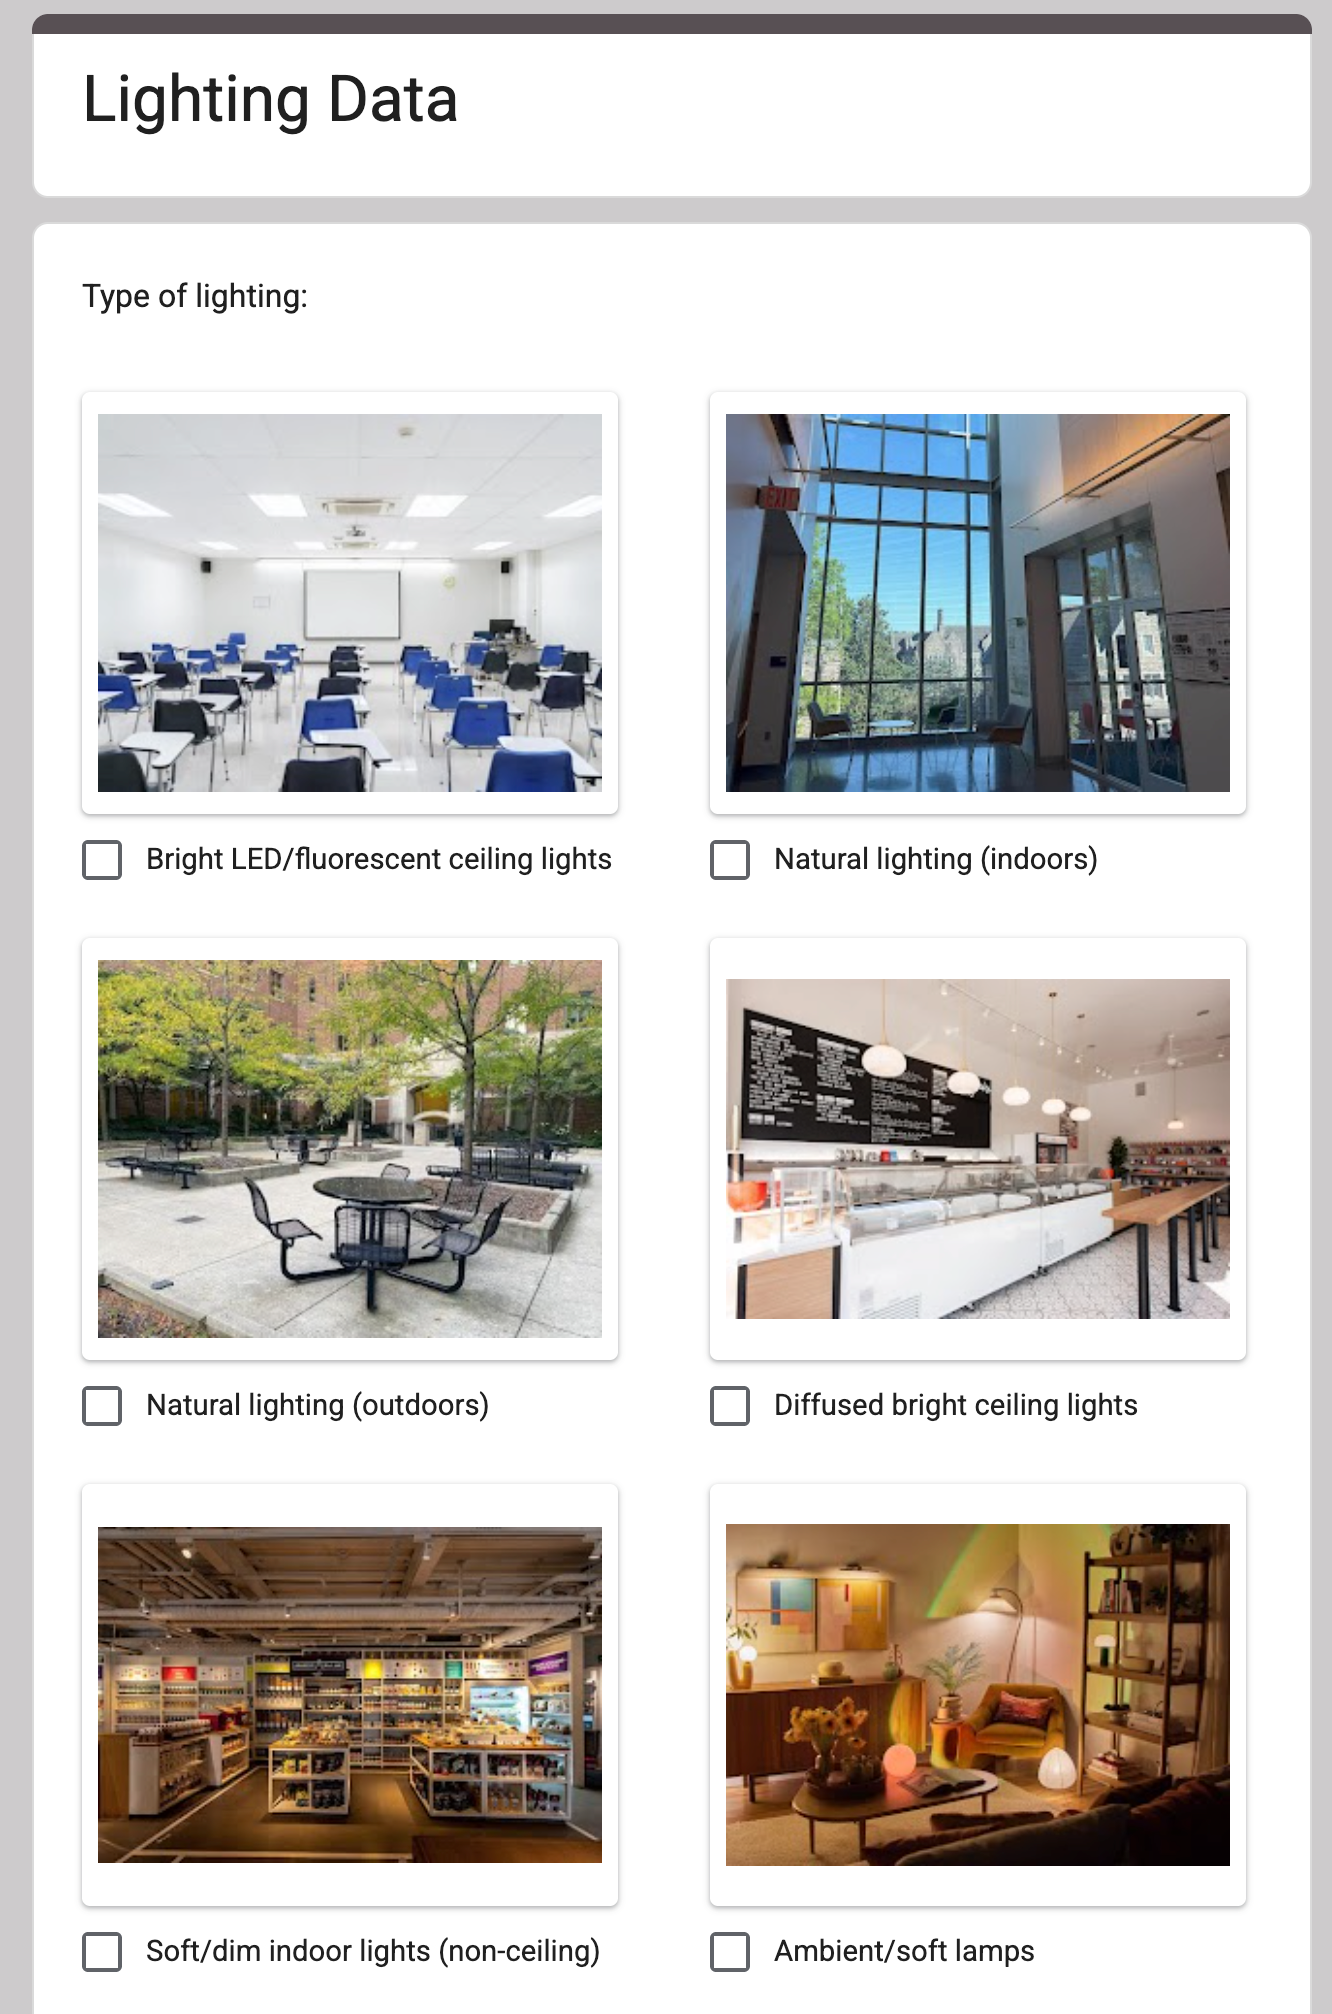
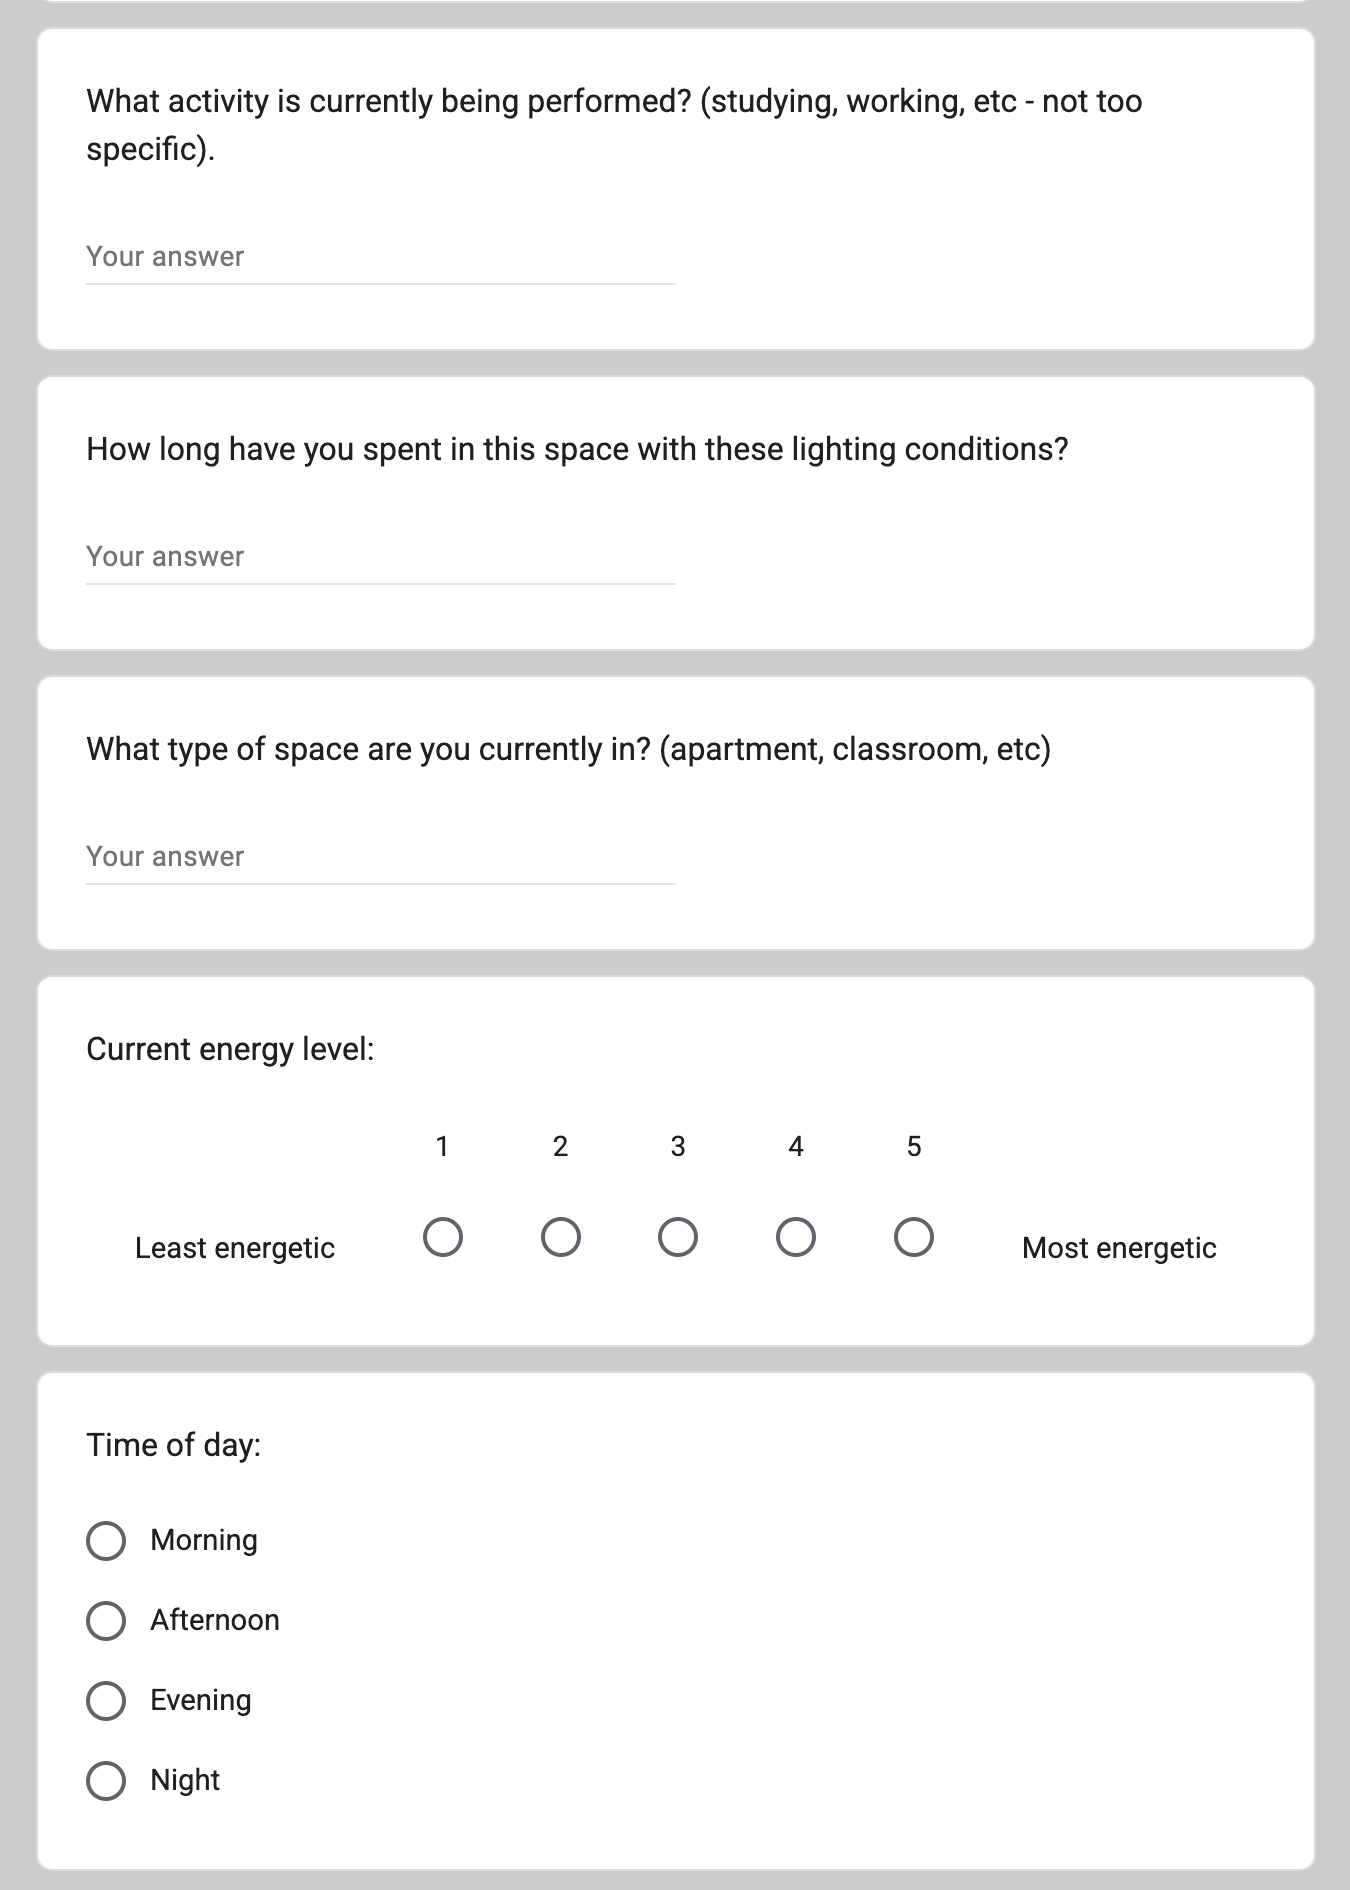
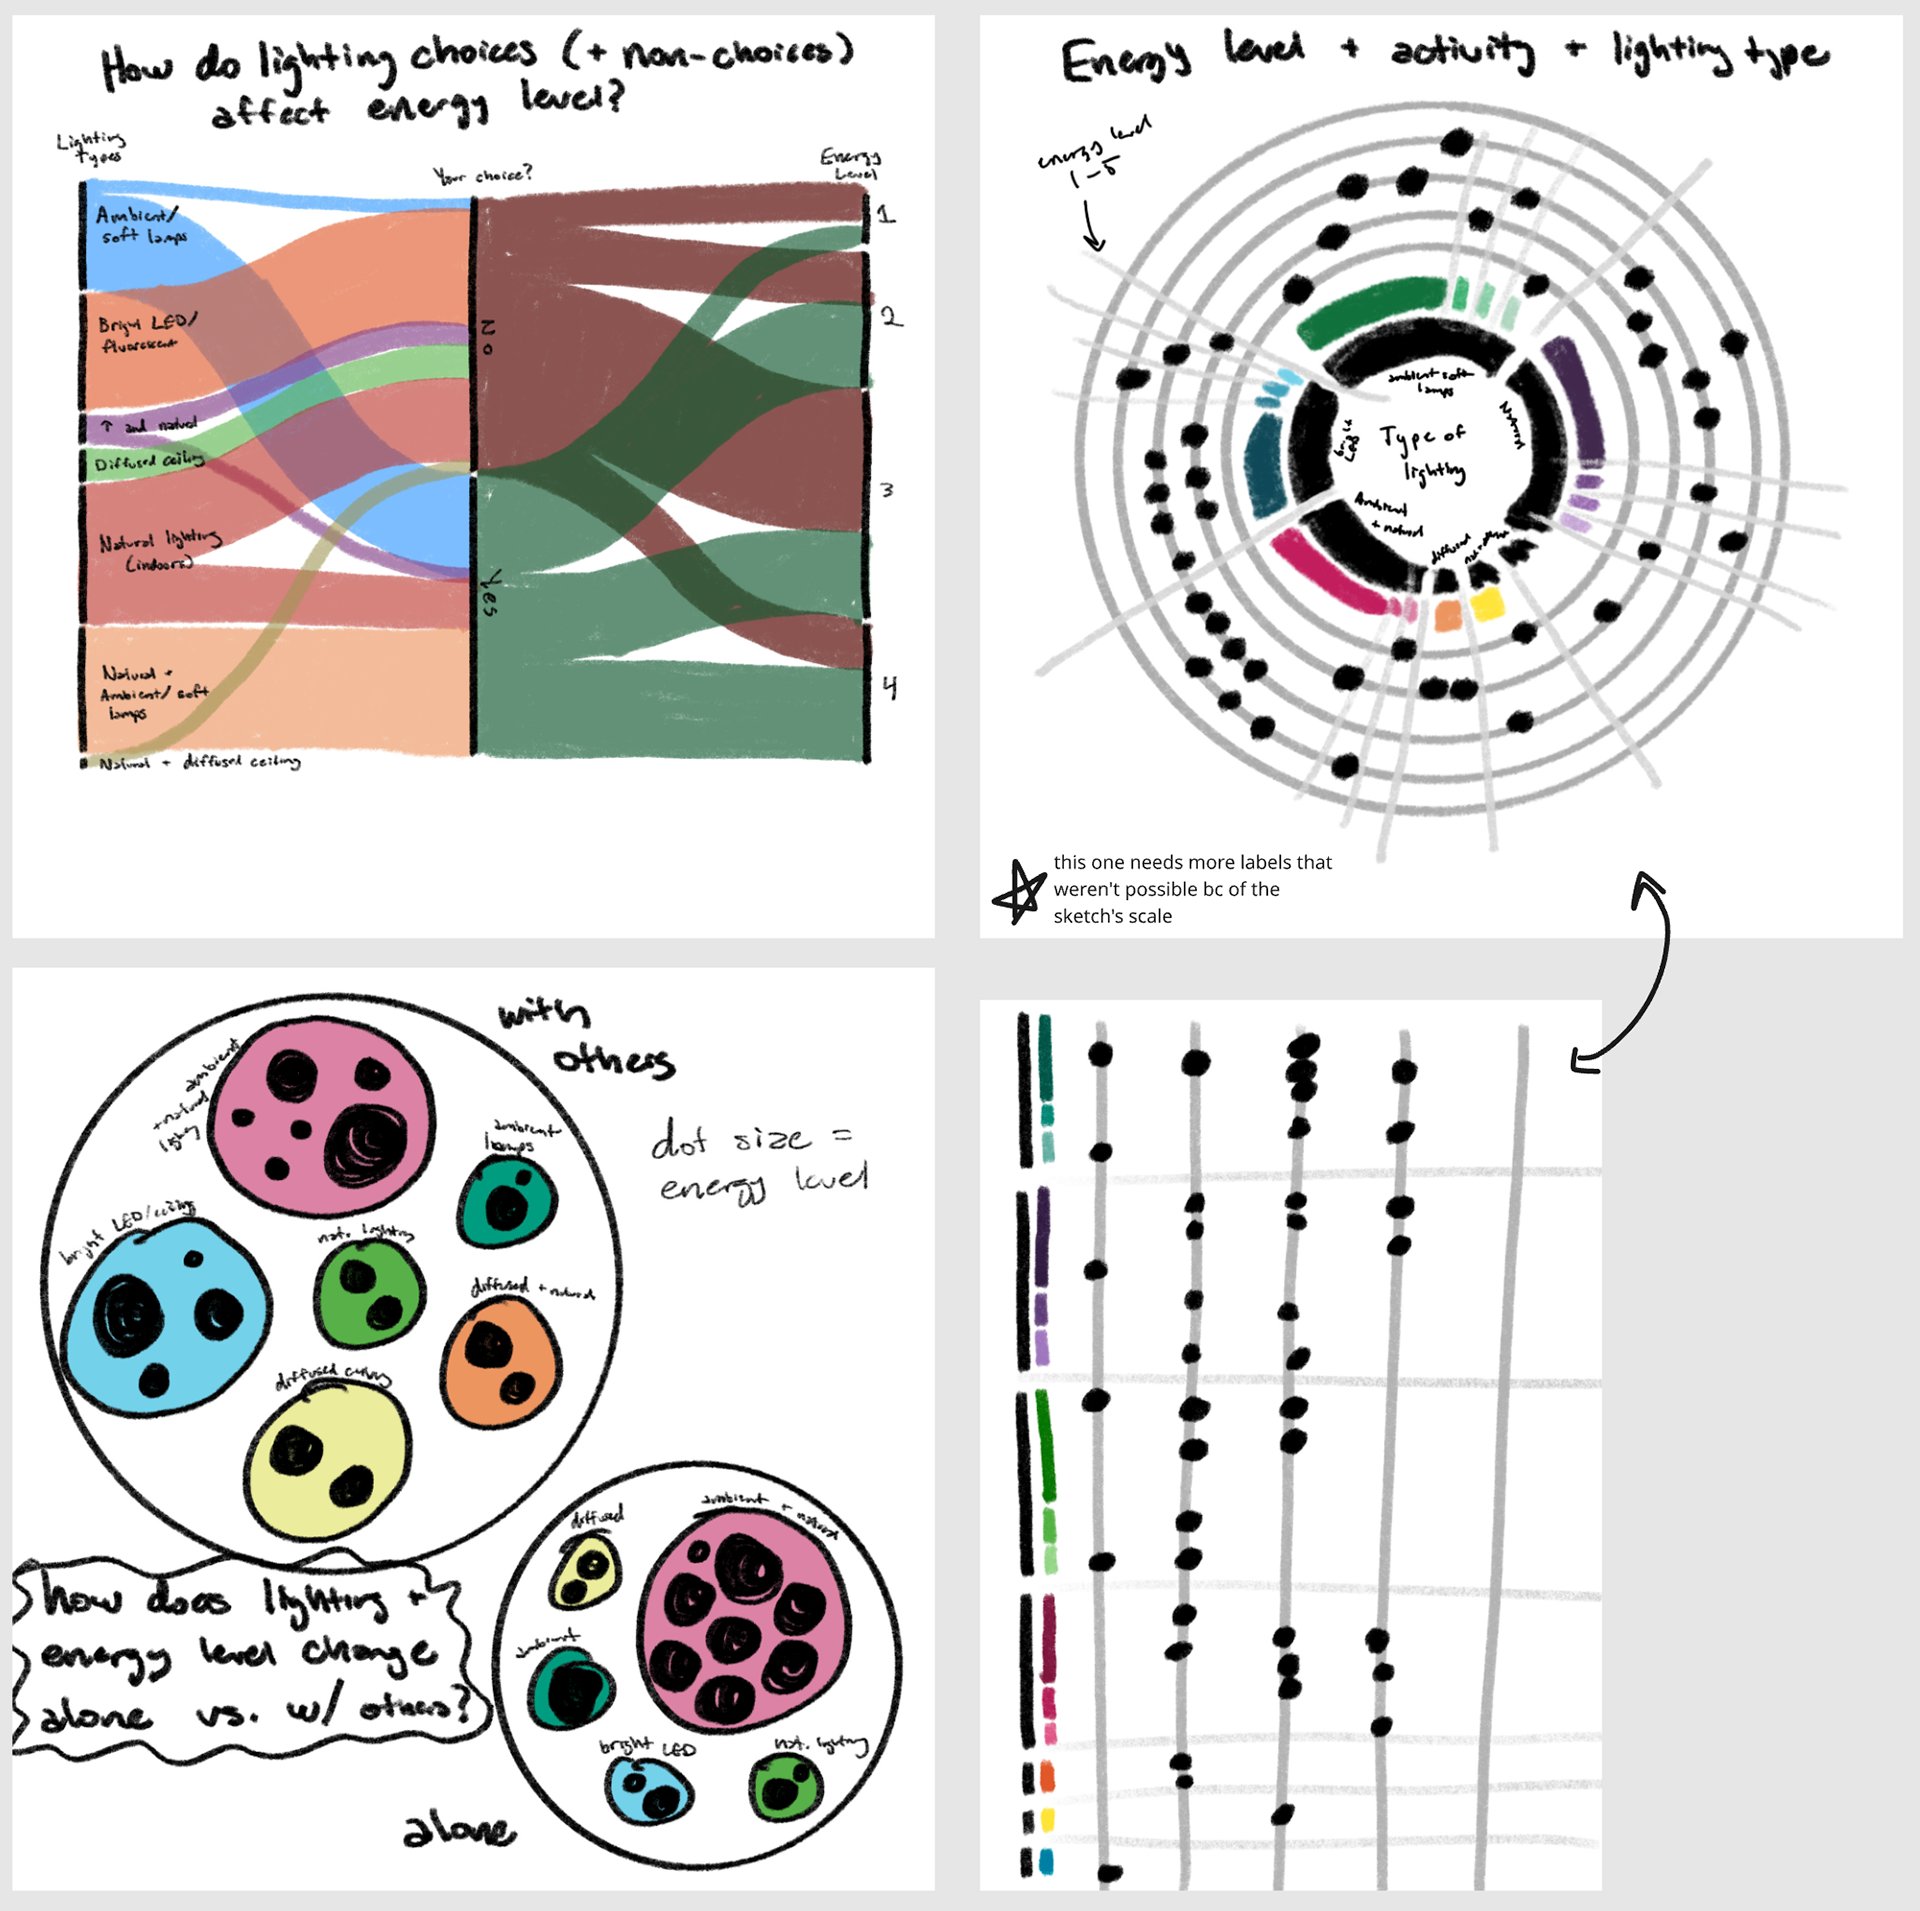
Next, I unpacked the data and analyzed its common themes. I was interested in visualizing his personal energy ratings and whether or not he chose his lighting conditions, and these variables were centered in many of my initial sketches. I began by focusing on functionality and successfully communicating multiple data categories at once, but I eventually pivoted to a style that was more visually relevant to the data set.
Part Two: Physical Representation
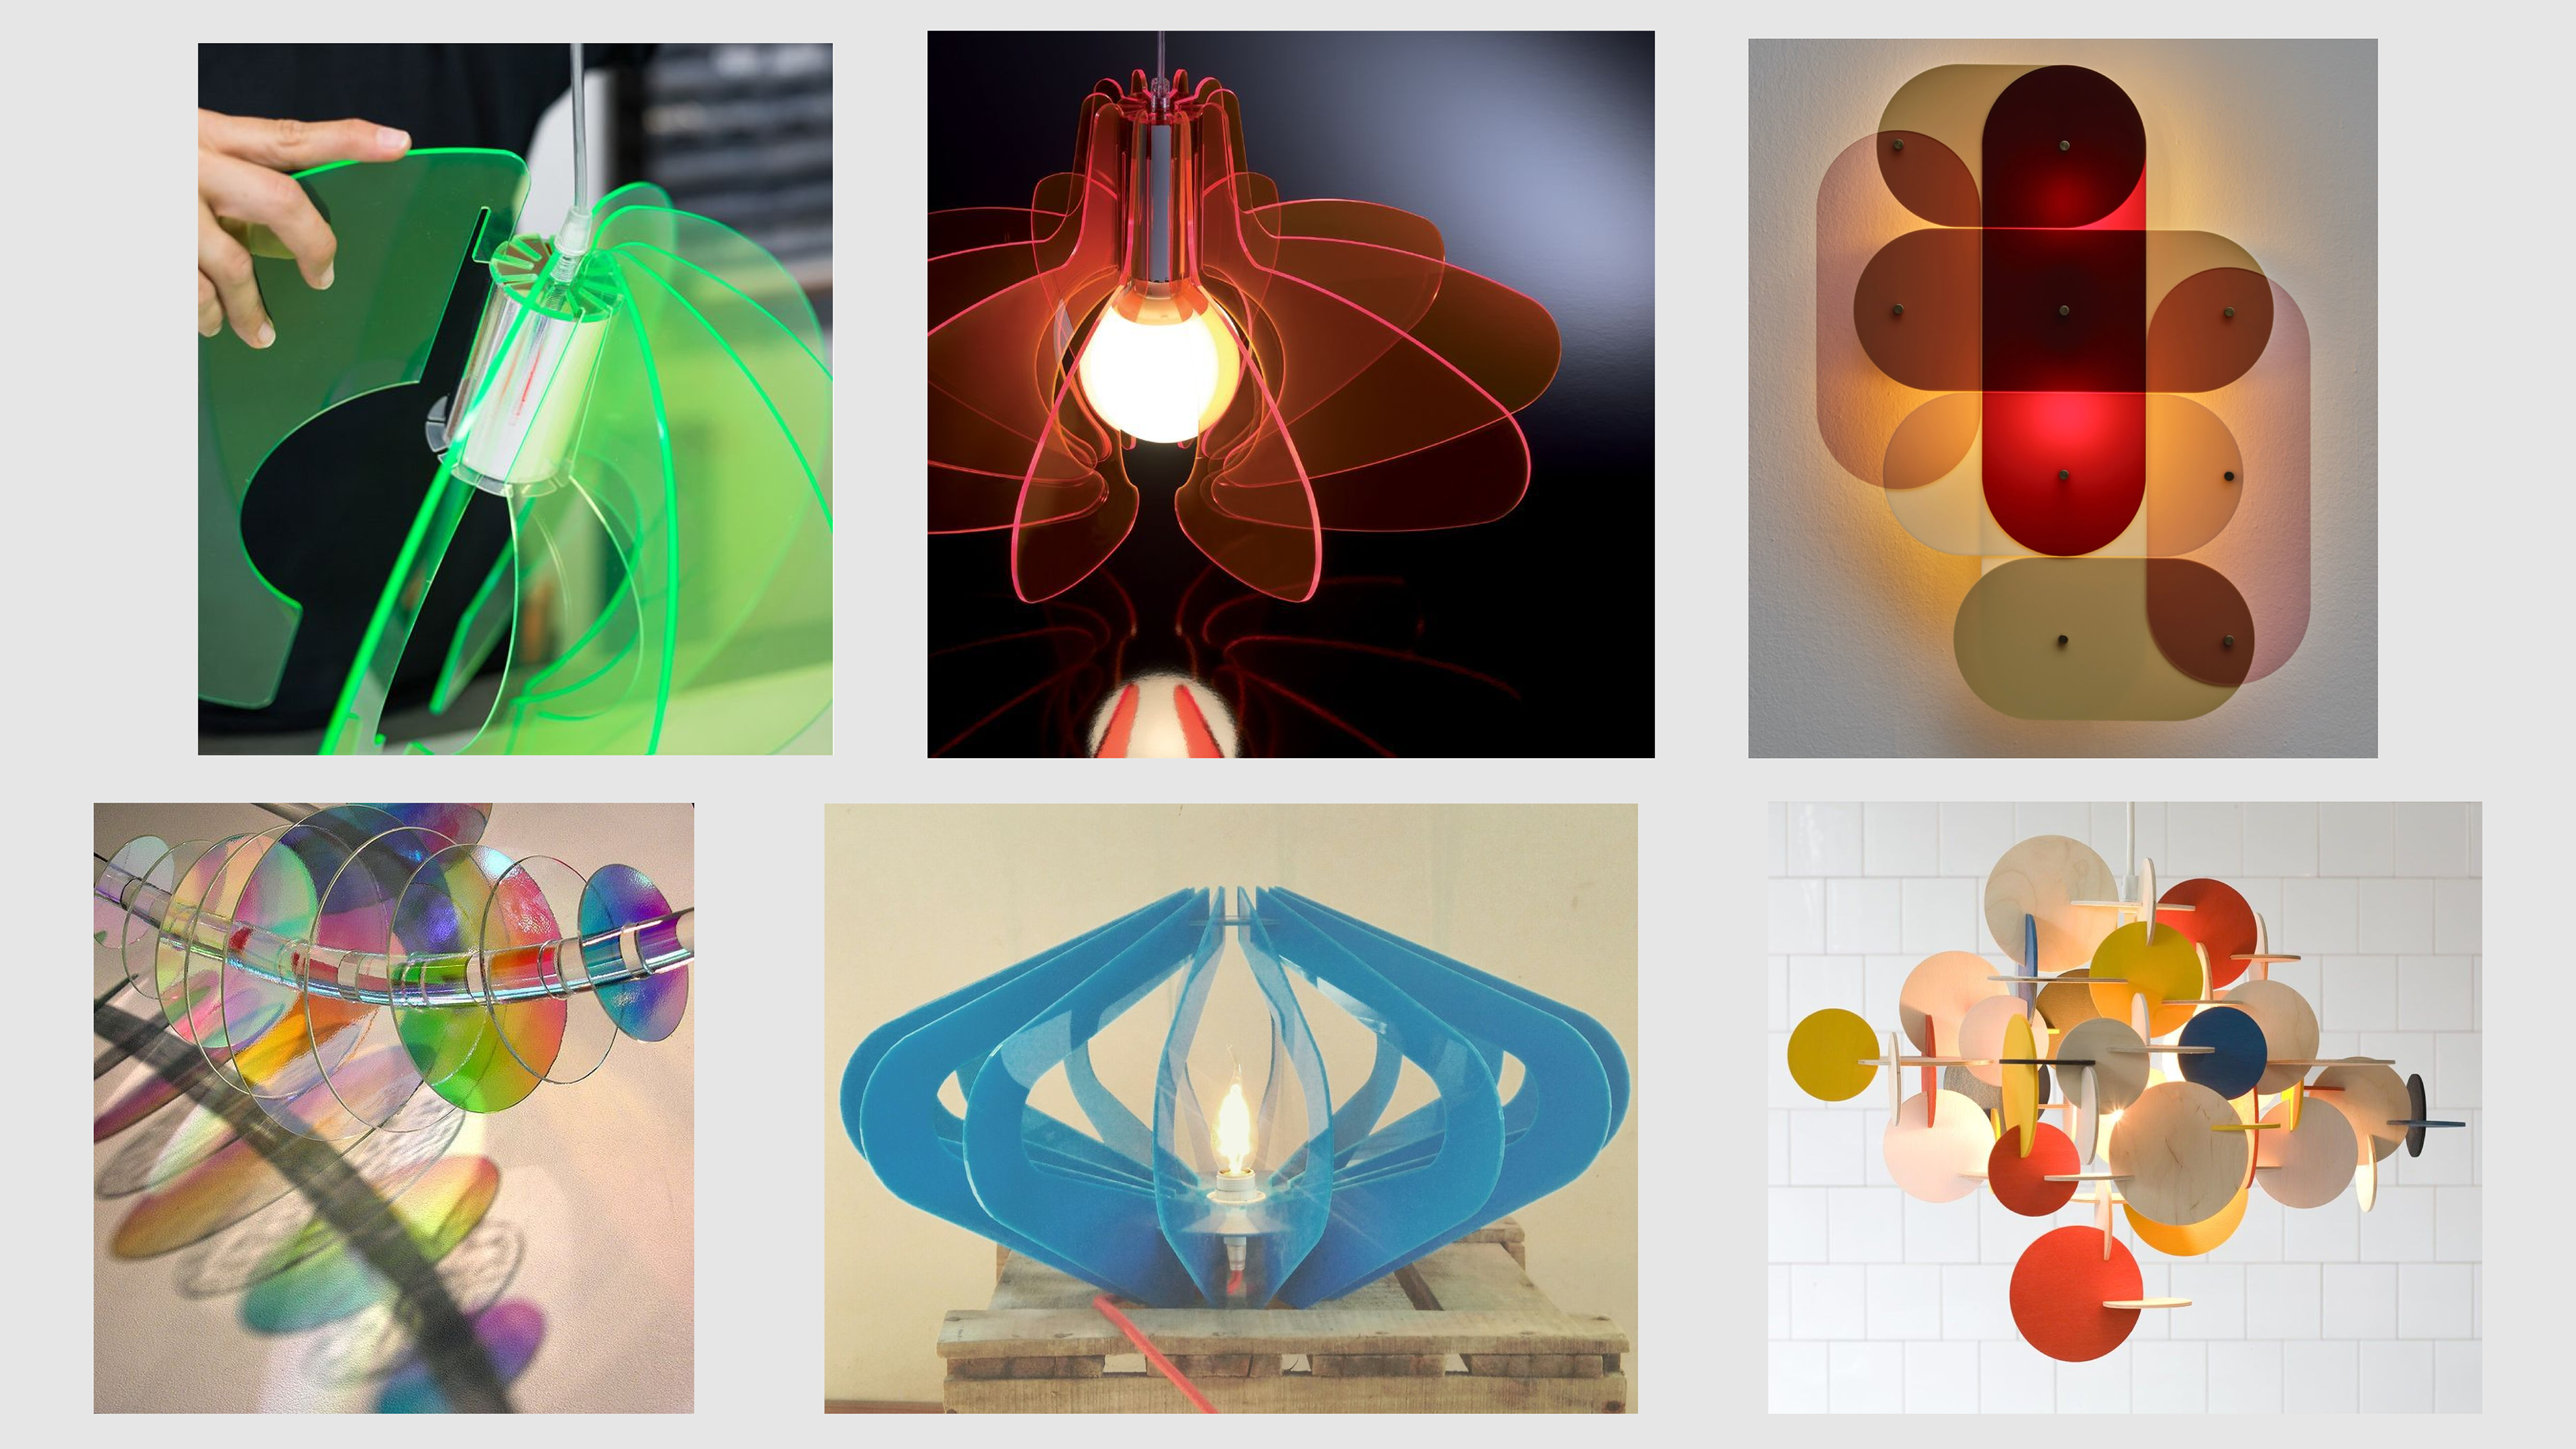
From the beginning, I knew I wanted to create an abstract light-related form with a practical or aesthetic purpose for Jonah and his lighting preferences. After doing some research on unique forms in these categories, I settled on translucent acrylic as my primary material, as I was interested in how this material interacted with light passing through it. I planned to create a piece that could sit near a wall and project color in its surrounding spaces, relating back to Jonah's favorite types of lighting and how these conditions have projected onto other aspects of his life, such as his energy level.
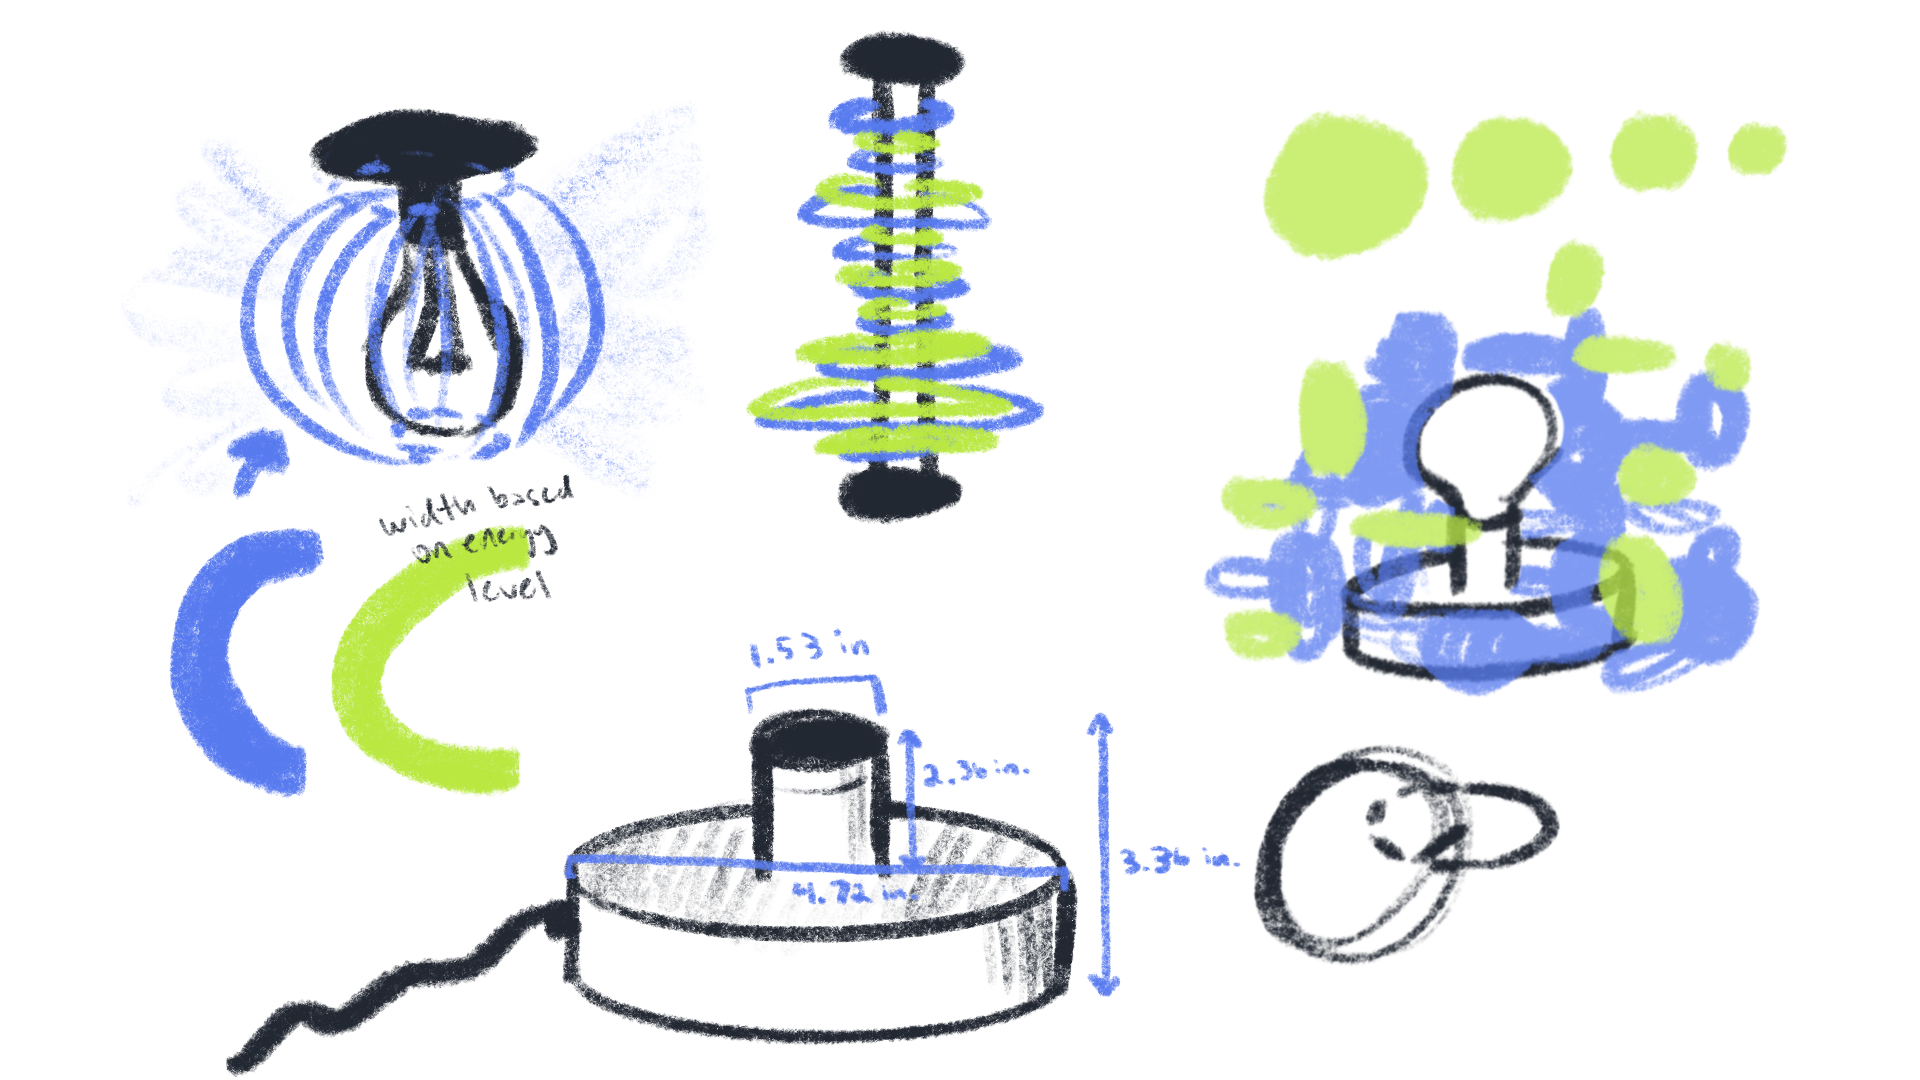
After some tests with paper and cardboard, I settled on a modular form made entirely of circles, which would make a "lampshade"/frame around a lightbulb in the center. I struggled to visualize exactly how this would work, so I decided to create a 3D model before preparing my laser cutter files and final sketches. This was my first time working with a 3D model from scratch, so it is definitely imperfect, which is not an ideal quality to translate into an unforgiving material like acrylic. Because of this, my final lamp does not perfectly mirror the model; however, it includes all of the same data and clusters, just in an arch shape rather than a perfectly enclosed shape.
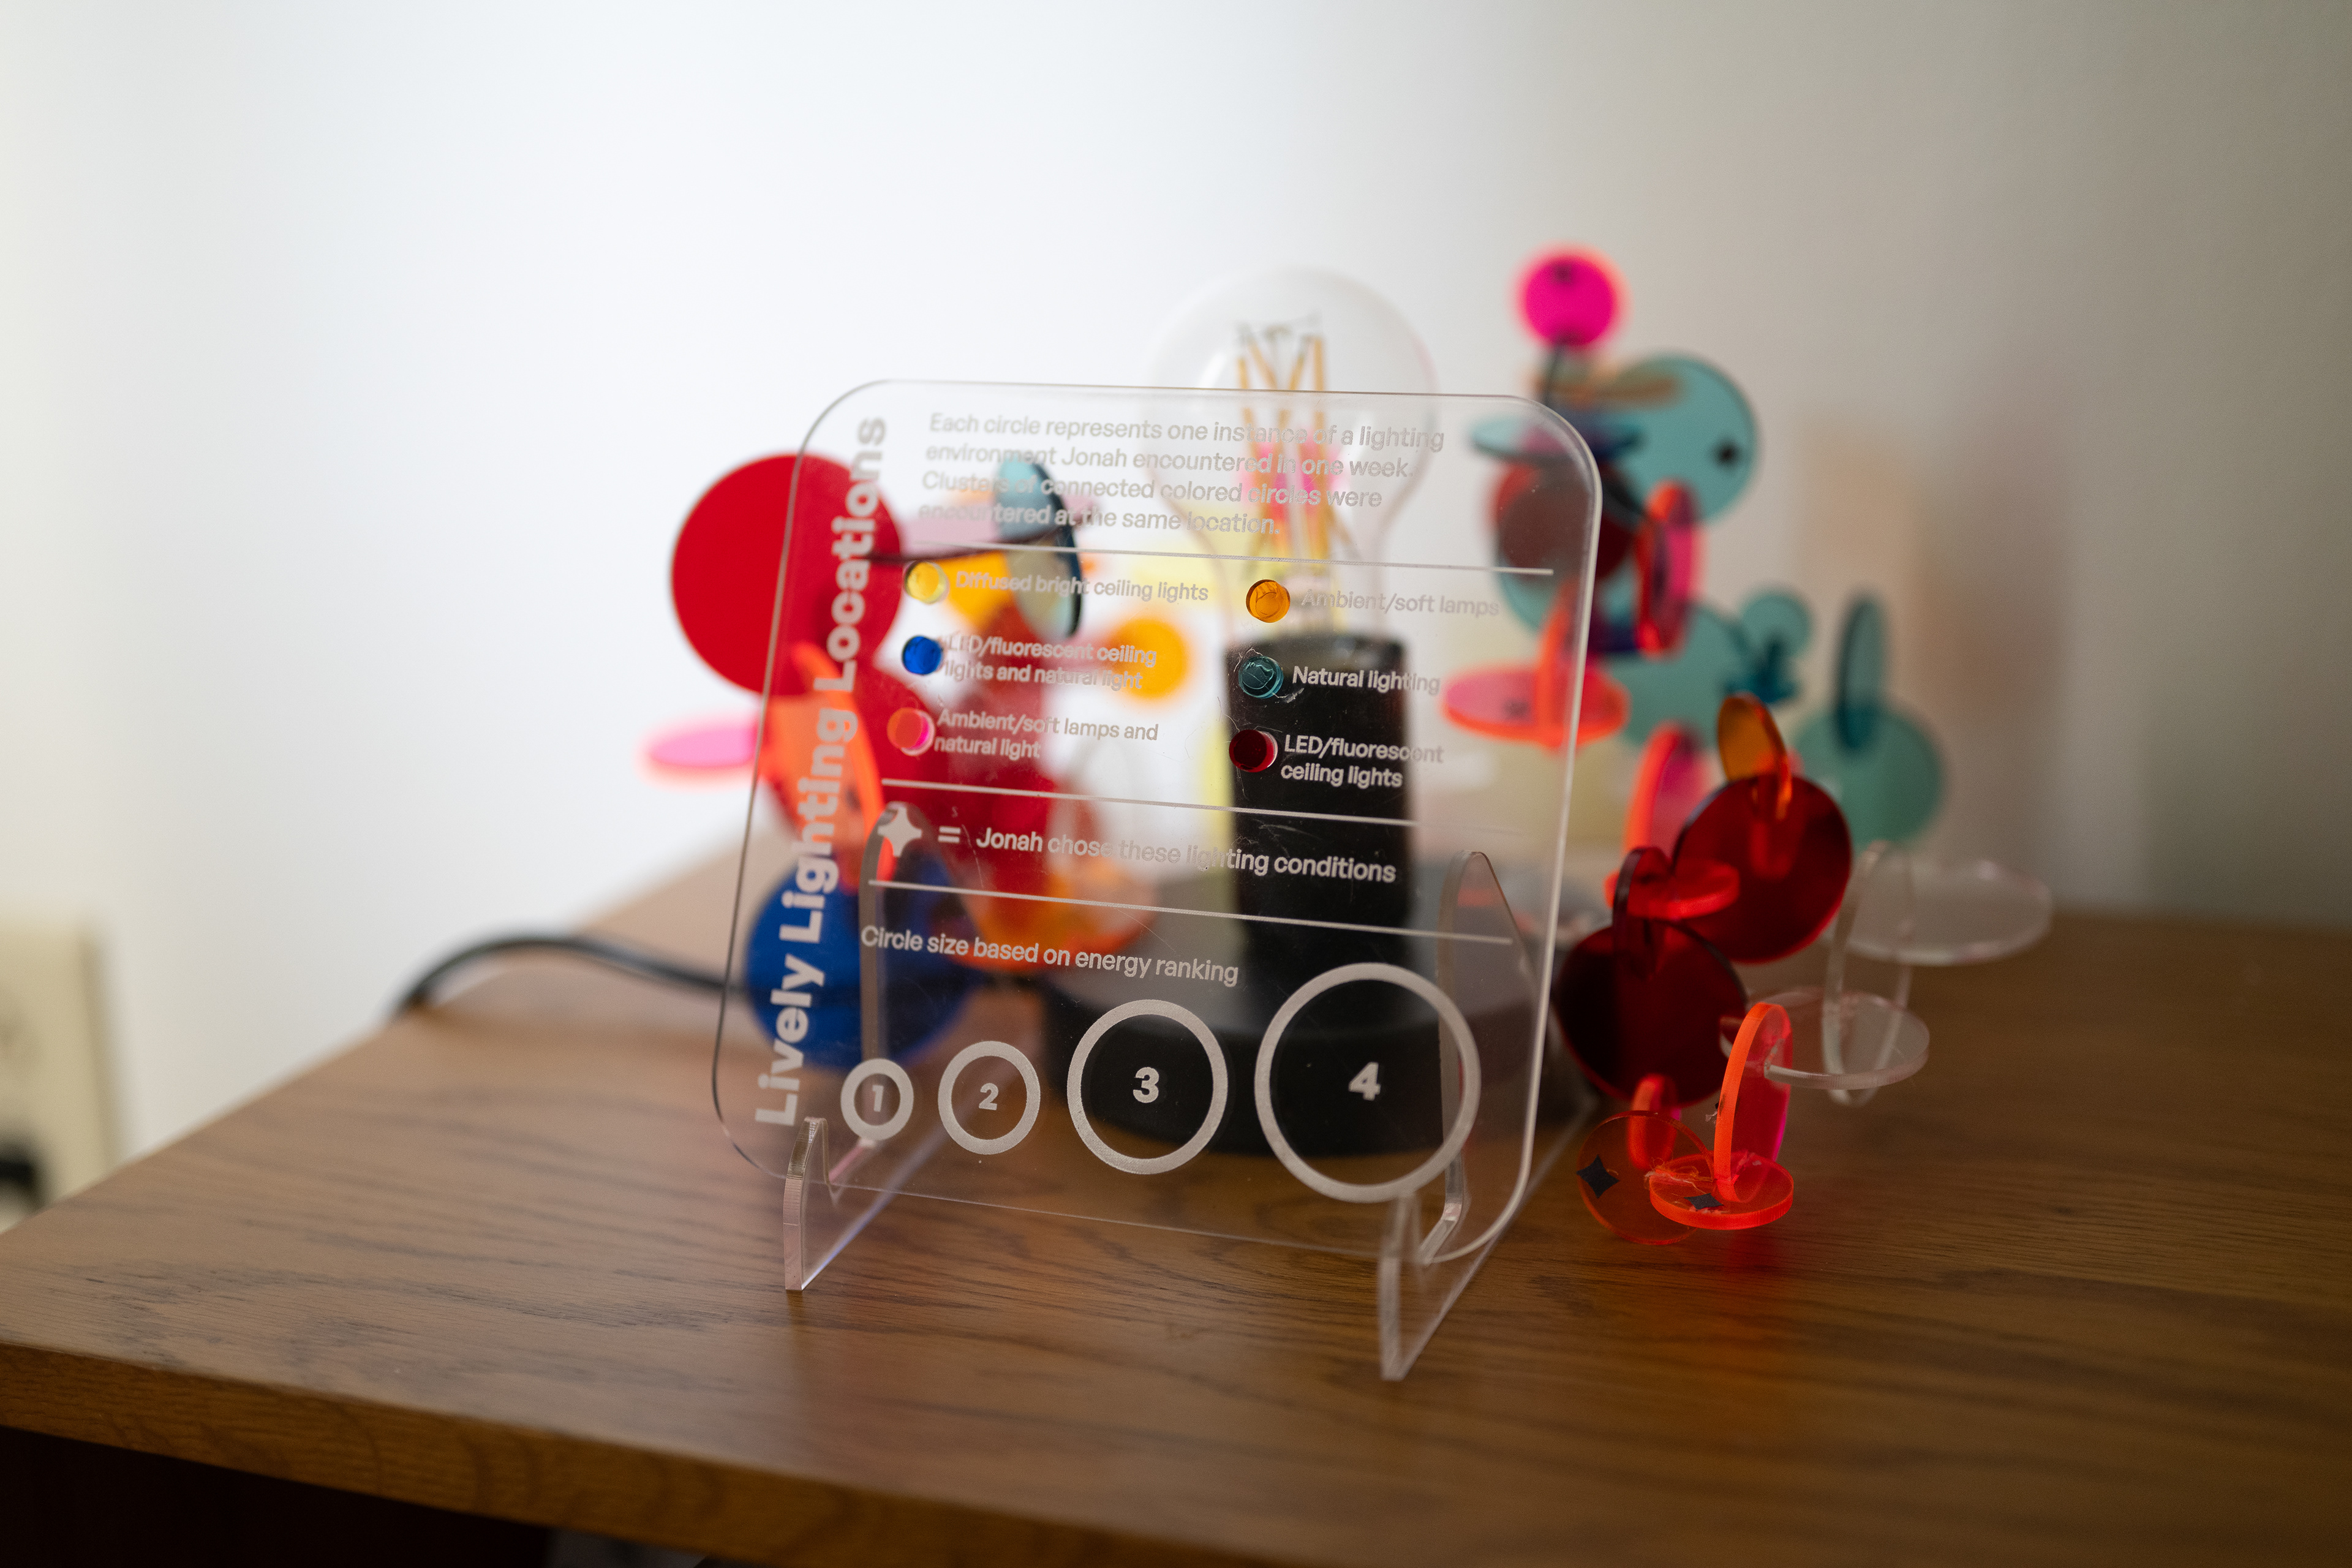
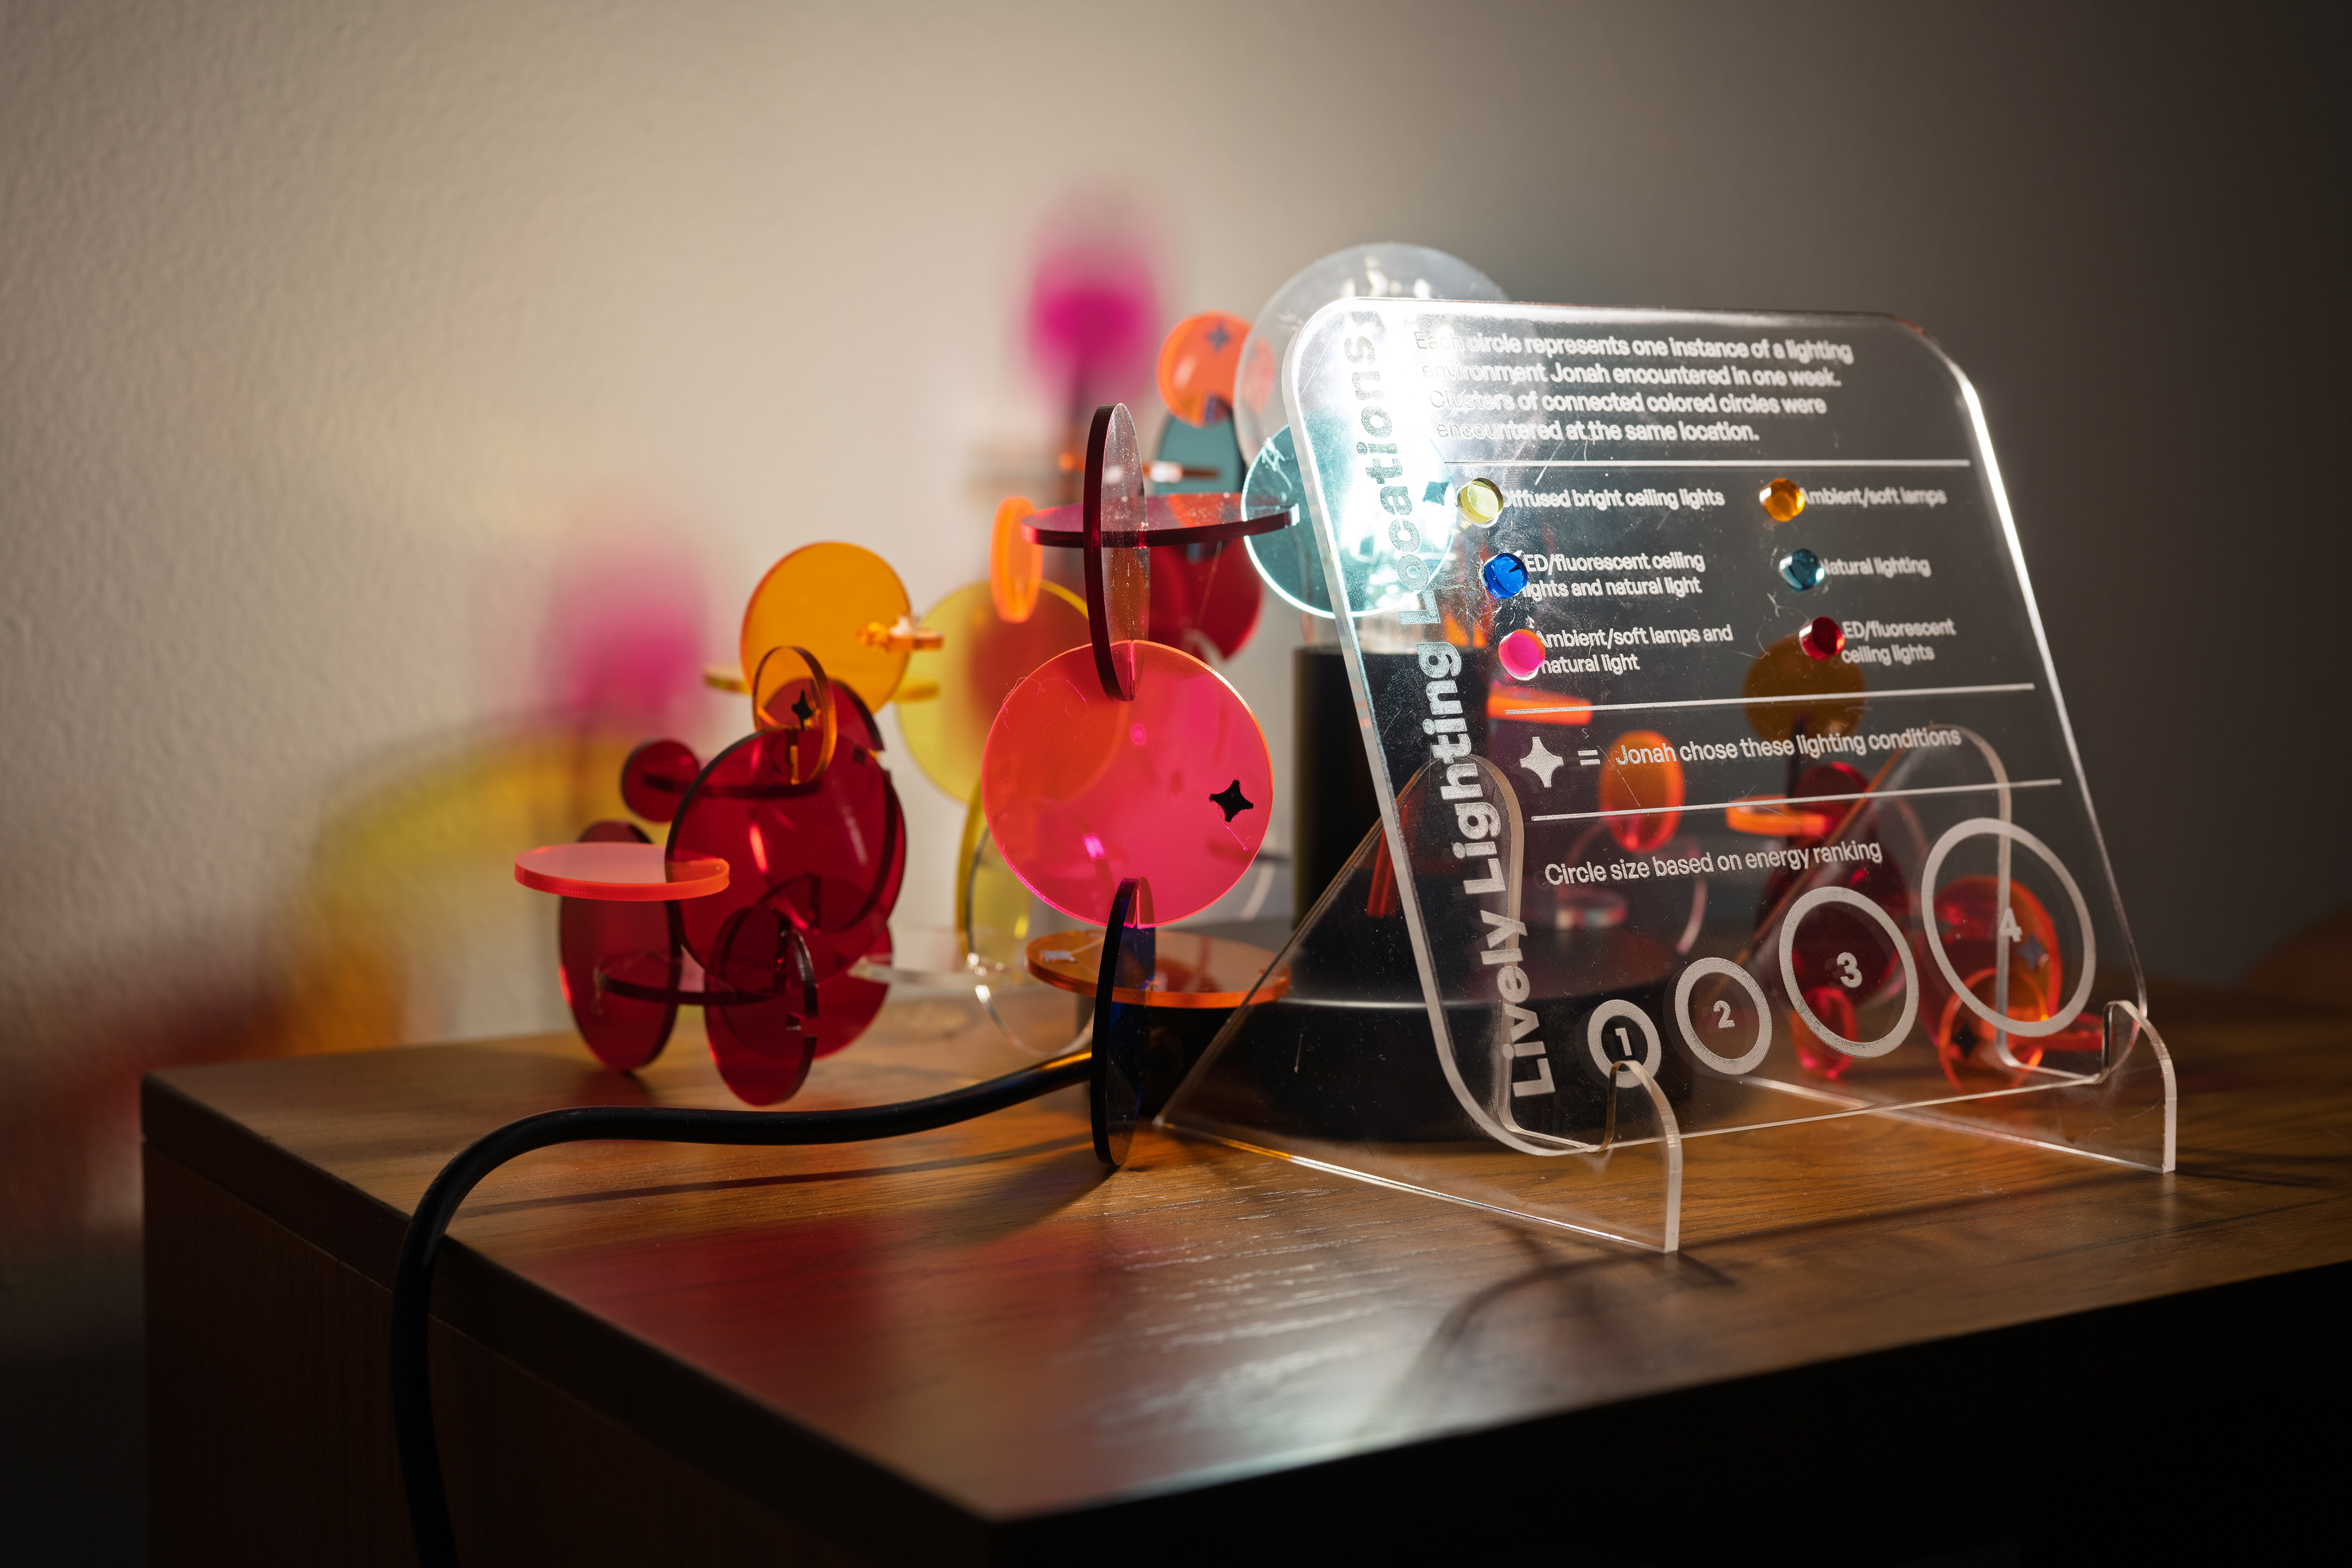
Additionally, to create more distinction between the poster and physical representation, I decided to pivot towards focusing on a variable that was not included on my poster. I eventually landed on the "type of location" variable from my data set, so the data points are clustered by the type of location at which they were recorded. This form also allows the viewer to interact with the data in a new way as it is projected onto the surrounding space, a quality that cannot be achieved by a flat poster.
Below are photos of the final lamp structure, including an additional key that can either be displayed next to the piece for additional info, or entirely omitted if the piece is displayed for purely aesthetic purposes.